13.2.1 Graphs of Functions, PT3 Focus Practice
Question 1:
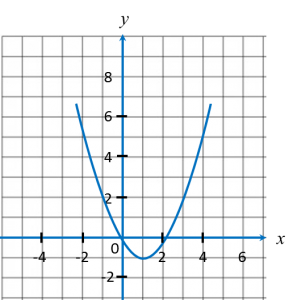
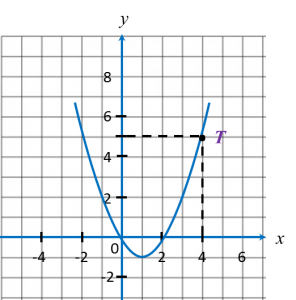
In the figure shown, when x = 4, the value of y is
Solution:
T is the point on the graph where x = 4.
Hence, when x = 4, y = 5.
Question 2:
Diagram shows the graph of a function on a Cartesian plane.
The equation that represents the function is
Solution:
Use points (0, 6) and (-3, 0) to determine the function.
|
Function
|
Value of y when
|
|
|
x = 0
|
x = –3
|
|
|
y = x + 3
|
3
|
0
|
|
y = x – 3
|
–3
|
–6
|
|
y = 2x + 6
|
6
|
0 (correct)
|
|
y = 2x – 6
|
–6
|
–12
|
Question 3:
Table below shows the values of variables x and y of a function.
|
x
|
–2
|
0
|
1
|
|
y
|
–6
|
2
|
3
|
Which of the following functions is satisfied by the ordered pair?
A y = 7x + 2
B y = x3 + 2
C y = x + x2 – 2
D y = x2 + 2
Solution:
Only y = x3 + 2 is satisfied by all the ordered pairs.
(i) –6 = (–2)3 + 2
(ii) 2 = 03 + 2
(iii) 3 = 13 + 2
Answer = B


