14.2.1 Ratio, Rates and Proportions II, PT3 Focus Practice


Question 1:
The distance from town A to town B is 120 km. A car leaves town A for town B at 11.00 a.m. The average speed is 80 km h-1 .
At what time does the car arrive at town B.

Solution:
Time taken=distance travelledaverage speed=120 km80 km h1=32 hours= 1 hour 30 minutes1 hour 30 minutes after 11.00 a.m. is 12.30 p.m.


Question 2:
Kenny drives his car from town P to town Q at a distance of 180 km in 3 hours.
Faisal takes 30 minutes less than Kenny for the same journey.
Calculate the average speed, in km/h, of Faisal’s car.

Solution:
Time taken by Faisal= 3 hours30 minutes= 3 hours12 hour= 212 hoursAverage speed of Faisal's car=distance travelledtime taken=180 km212 hours=72 km/h


Question 3:
Rafidah drives her car from town L to town M at an average speed of 90 km/h for 2 hours 40 minutes. She continues her journey for a distance of 100 km from town M to town N and takes 1 hour 20 minutes.
Calculate the average speed, in km/h, for the journey from L to M.

Solution:
Distance=average speed×time takenDistance from L to M=90×24060  =90×223  =90×83  =240 kmTotal distance from L to N=240+100  =340 kmTotal time taken = 2 hours 40 minutes + 1 hour 20 minutes   = 4 hoursAverage speed for the journey from L to N=340 km4 h   =85 km/h


Question 4:
Susan drives at an average speed of 105 km/h from town F to town G.
The journey takes 3 hours.
Susan takes 30 minutes longer for her return journey from town G to town F. Calculate the average speed, in km/h, for the return journey.

Solution:
Distance from F to G= 105 km/h×3 hours=315 kmAverage speed for return journey=distance travelledtime taken=315 km312 hours=90 km/h


Question 5:
Table below shows the distances travelled and the average speeds for four vehicles.

Vehicle Distance (km) Average speed (km/h)
A 230 115
B 250 100
C 170 85
D 245 70
Which vehicles took the same time to complete the journey?

Solution:
Time taken for vehicle A=230115=2 hoursTime taken for vehicle B=250100=212 hoursTime taken for vehicle C=17085=2 hoursTime taken for vehicle D=24560=312 hours

Thus, the vehicles A and C took the same time to complete the journey.

13.2.3 Graphs of Functions, PT3 Focus Practice


Question 7:
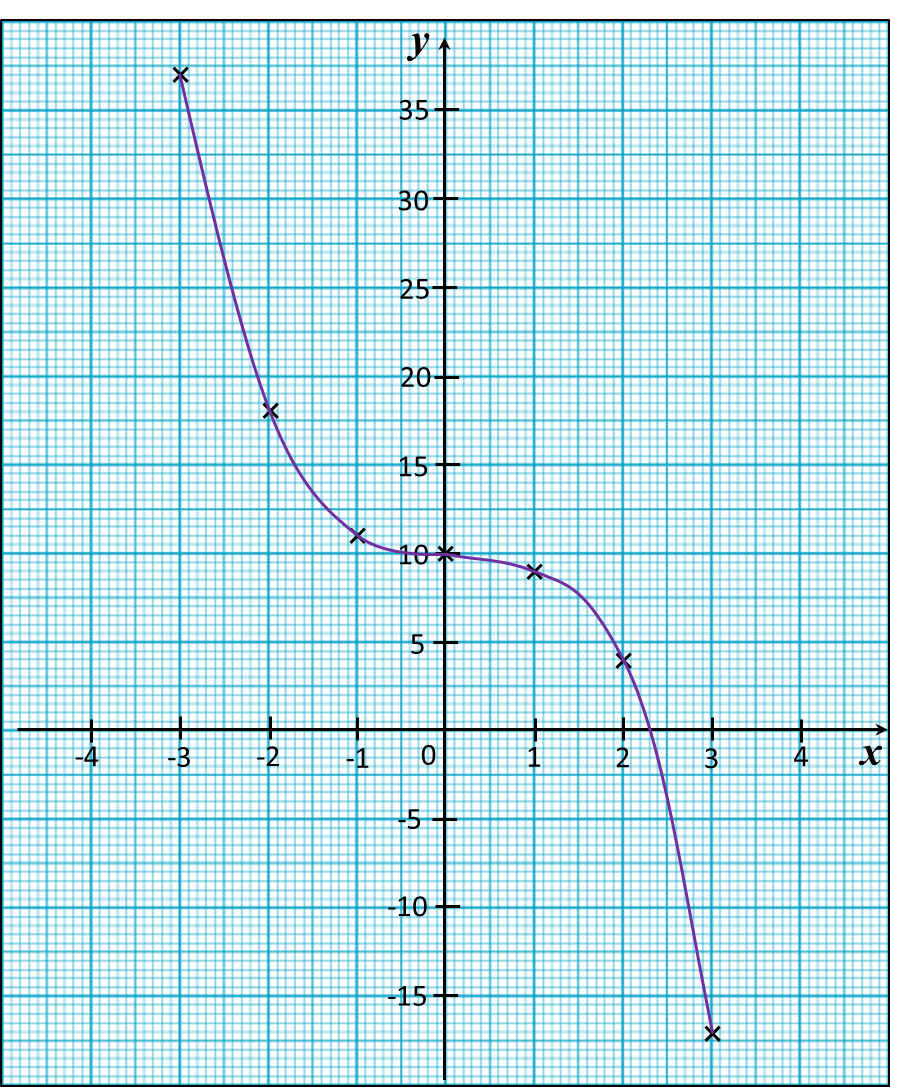
Use graph paper to answer this question.
Table below shows the values of two variables, x and y, of a function.


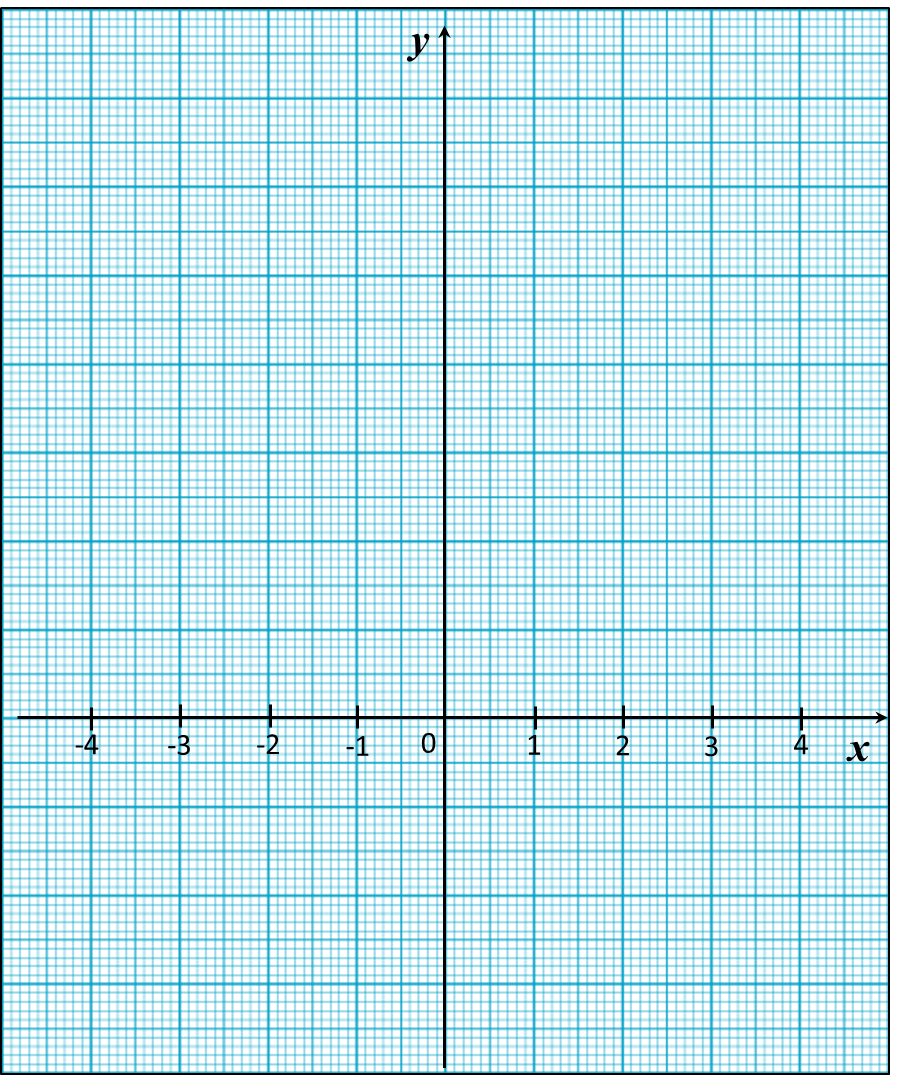
The x-axis and the y-axis are provided on the graph paper on the answer space.
(a) By using a scale of 2 cm to 5 units, complete and label the y-axis.
(b) Based on the table above, plot the points on the graph paper.
(c) Hence, draw the graph of the function.

Answer:


Solution:


Question 8:
Use graph paper to answer this question.
Table below shows the values of two variables, x and y, of a function.


The x-axis and the y-axis are provided on the graph paper on the answer space.
(a) By using a scale of 2 cm to 2 units, complete and label the y-axis.
(b) Based on the table above, plot the points on the graph paper.
(c) Hence, draw the graph of the function.

Answer:


Solution:


13.2.2 Graphs of Functions, PT3 Focus Practice


13.2.2 Graphs of Functions, PT3 Focus Practice

Question 4:
Use graph paper to answer this question.
Table below shows the values of two variables, x and y, of a function.

x
–3
–2
–1
0
1
2
3
y
–19
–3
1
–1
–3
1
17
The x-axis and the y-axis are provided on the graph paper on the answer space.
(a) By using a scale of 2 cm to 5 units, complete and label the y-axis.
(b) Based on the table above, plot the points on the graph paper.
(c) Hence, draw the graph of the function.

Answer:


Solution:


Question 5:
Use graph paper to answer this question.
Table below shows the values of two variables, x and y, of a function.

x
–4
–3
–2
–1
0
1
2
y
31
17
7
1
–1
1
7
The x-axis and the y-axis are provided on the graph paper on the answer space.
(a) By using a scale of 2 cm to 5 units, complete and label the y-axis.
(b)   Based on the table above, plot the points on the graph paper.
(c) Hence, draw the graph of the function.


Answer:


Solution:


Question 6:
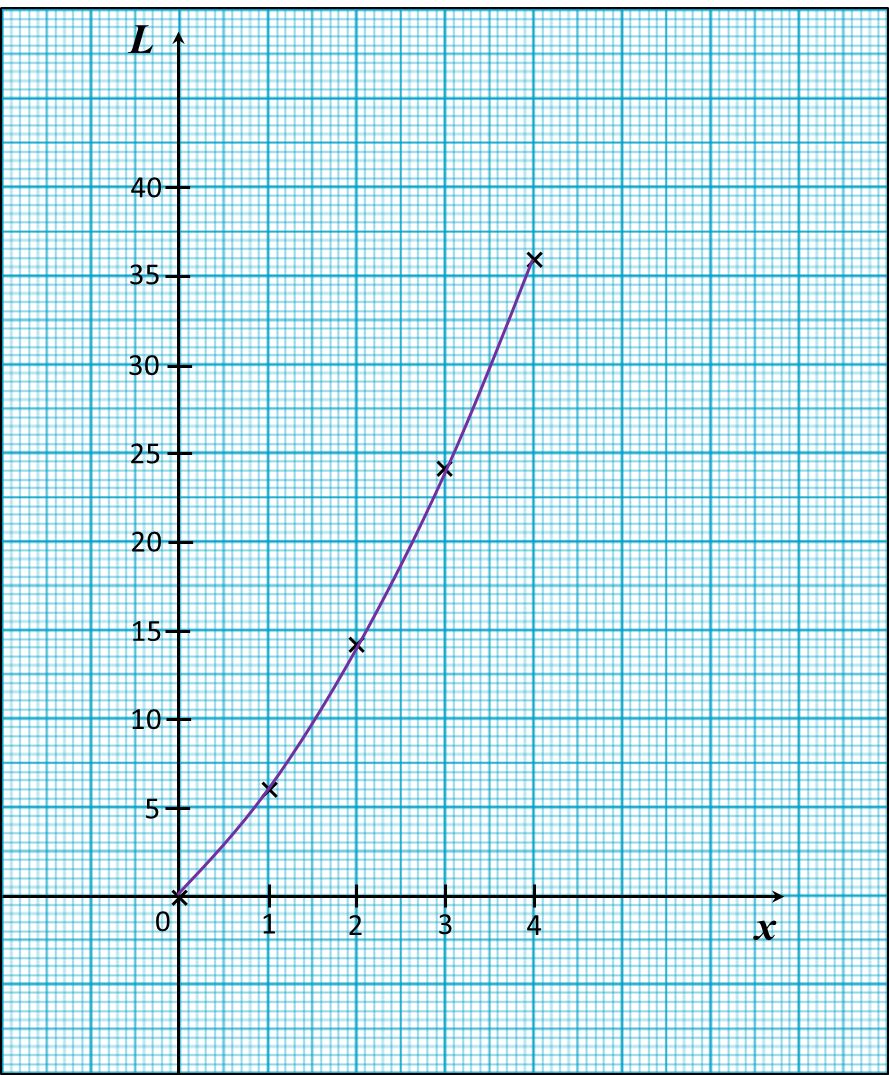
(a) Complete table below in the answer space for the equation L = x2 + 5x by writing the value of L when x = 2.
(b) Use graph paper to answer this part of the question. You may use a flexible curve rule.
By using a scale of 2 cm to 1 unit on the x-axis and 2 cm to 5 units on the y-axis, draw the graph of L = x2 + 5x for 0 ≤ x ≤ 4.

Answer:


Solution:
(a)
When x = 2
L = 22 + 5(2)
= 4 + 10
= 14  

(b)


13.2.1 Graphs of Functions, PT3 Focus Practice


13.2.1 Graphs of Functions, PT3 Focus Practice
 
Question 1:
 
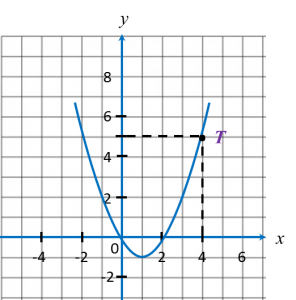
In the figure shown, when x = 4, the value of y is

Solution:
 
is the point on the graph where x = 4.
Hence, when x = 4, y = 5.


Question 2:
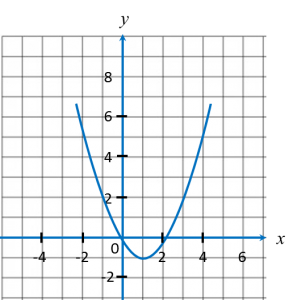
Diagram shows the graph of a function on a Cartesian plane.
 
The equation that represents the function is
 
Solution:
Use points (0, 6) and (-3, 0) to determine the function.

Function
Value of y when
x = 0
x = –3
y = x + 3
3
0
y = x – 3
–3
–6
y = 2x + 6
6
0 (correct)
y = 2x – 6
–6
–12

Question 3:
Table below shows the values of variables x and y of a function.
 
x
–2
0
1
y
–6
2
3
Which of the following functions is satisfied by the ordered pair?
A = 7x + 2
B = x3 + 2
C = x + x2 – 2
D = x2 + 2

Solution:
Only y = x3 + 2 is satisfied by all the ordered pairs.
(i) –6 = (–2)3 + 2
(ii)   2 = 03 + 2
(iii)  3 = 13 + 2
Answer = B

13.1 Graphs of Functions


13.1 Graphs of Functions
 
13.1.1 Functions
1.   Function is a relationship that expresses a variable (dependent) in terms of another variable (independent).


2.   is a function of x if and only if every value of x corresponds to only one value of y.


13.1.2  Graphs of Functions
1.   A graph of function is a representation of the function as one or more lines on a coordinate plane.
Example:

2.  
When drawing graphs of functions, it is best to observe these few points:
· choose suitable scales for both axes.
· use at least three points to draw a straight line to ensure accuracy.
· use at least five points to draw a curve to ensure accuracy.

12.2.2 Linear Inequalities, PT3 Focus Practice


Question 6:
List all the integer values of x which satisfy the following linear inequalities:
–2 < 3x + 1 ≤ 10

Solution:
–2 < 3x + 1
–3 < 3x
x > –1
x = 0, 1, 2, 3, …

3x + 1 ≤ 10
3x ≤ 9
x ≤ 3
x = 3, 2, 1, 0, …

Therefore x = 0, 1, 2, 3


Question 7:
List all the integer values of x which satisfy the following linear inequalities:
–5 < 2x – 3 ≤ 1

Solution:
–5 < 2x – 3
–5 + 3 < 2x
2x > –2
x > –1
x = 0, 1, 2, 3, …  

2x – 3 ≤ 1
2x ≤ 4
x ≤ 2
x = 2, 1, 0, –1, …

Therefore x = 0, 1, 2


Question 8:
Given that 3<x2<4 and x is an integer. List all the possible values of x.

Solution:

3<x2<432<x2<429<x2x>11 or   x2<16x<1811<x<18x=12, 13, 14, 15, 16, 17


Question 9:
Find the biggest and the smallest integer of x that satisfy
3x + 2 ≥ –4 and 4 – x > 0.

Solution:
3x + 2 ≥ –4
3x ≥ –4 – 2
3x ≥ –6
x ≥ –2

4 – x > 0
x > –4
x < 4

Smallest integer of x is –2, and the biggest integer of x is 3.


Question 10:
If xhy satisfy the two inequalities 7h25 and 3(h+2)20+h, find the values of x and y.

Solution:

7h25h257h4h43(h+2)20+h3h+620+h2h14h74h7x=4,y=7

12.2.1 Linear Inequalities, PT3 Focus Practice


12.2.1 Linear Inequalities, PT3 Focus Practice

Question 1:
Draw a number line to represent the solution for the linear inequalities –3 < 5 – x  ≤ 4.
 
Solution:
–3 < 5 – x   and   5 – x  ≤ 4
x < 5 + 3   and   x  ≤ 4 – 5
x < 8   and   x ≤ –1 → x  ≥ 1

Thus, the solution is 1 ≤ x < 8

Question 2:
Solve the following simultaneous linear inequalities.
3x51    and    213x<3

Solution:
3x – 5 ≤ 1
3x  ≤ 1 + 5
3x  ≤ 6
x  ≤ 2

213x<36x<9  Multiply by 3  x<96x<3x>3  Multiply by 1  
The solution is –3 < x  ≤ 2.


Question 3:
The solution for the inequality 2 + < 3x – 4 is
  
Solution:
2 + x < 3x – 4  
x – 3x < –4 – 2
–2x < –6
x < –3
x > 3


Question 4:
The solution for the inequality –2 (6y + 3) < 3 (4 – 2y) is

Solution:
–2 (6y + 3) < 3 (4 – 2y)
–12y – 6 < 12 – 6y
–12y + 6< 12 + 6
–6y < 18
y < 3
y > –3 


Question 5:
Solve each of the following inequalities.
(a) 3x + 4 > 5x – 10
(b)   –3  ≤ 2x + 1 < 7

Solution:
(a)
3x + 4 > 5x – 10
3x – 5x > –10 – 4
–2x > –14
x > –7
x < 7

(b)
–3 ≤ 2x + 1 < 7
–3 ≤ 2x + 1   and   2x + 1 < 7
–2x  ≤ 1 + 3   and   2x < 7 – 1
–2x  ≤ 4 and   2x < 6
≥ –2   and   x < 3

The solution is –2 ≤ x < 3.

12.1 Linear Inequalities


12.1 Linear Inequalities

12.1.1 Inequalities
1.   To write the relationship between two quantities which are not equal, we use the following inequality signs:
  > greater than
  < less than
  ≥ greater than or equal to
  ≤ less than or equal to

2.   7 > 4 also means 4 < 7.  7 > 4 and 4 < 7 are equivalent inequalities.


   12.1.2  Linear Inequalities in One Unknown
1.   An inequality in one unknown to the power of 1 is called a linear inequality.
Example: 2x + 5 > 7

2.  
A linear inequality can be represented on a number line.
  Example:

12.1.3 Computation on Inequalities
1.   When a number is added or subtracted from both sides of an inequality, the condition of the inequality is unchanged.
Example:
Given 5 > 3
Then, 5 + 2 > 3 + 2 ← (symbol ‘>’ remains)
Hence, 7 > 5

2.   When both sides of an inequality are multiplied or divided by the same positive number, the condition of the inequality is unchanged.
Example:
Given 4x ≤ 16
Then, 4x ÷ 4 ≤ 16 ÷ 4 ← (symbol ‘≤’ remains)
Hence, x ≤ 4

3.   When both sides of an inequality are multiplied or divided by the same negative number, the inequality is reversed.
Example:
Given –3 > –5
Hence, 3 < 5
Given –5y > –10
Then, –5y ÷ 5 > –10 ÷ 5
 –y > –2
Hence, y < 2


12.1.4 Solve Inequalities in One Variable
To solve linear inequalities in one variable, use inverse operation to make the variable as the subject of the inequality.

Example:
Solve the following linear inequalities.
(a) 32x<1(b) 52x37

Solution:
(a)
     32x<132x3<13       2x<2           2x>2          2x2>22             x>1

(b)
        52x37(52x3)×37×3         52x21           2x16               2x16              2x2162                 x8


12.1.5 Simultaneous Linear Inequalities in One Variable
1.   The common values of two simultaneous inequalities are values which satisfy both linear inequalities.
The common values of the simultaneous linear inequalities x ≤ 3 and x > –1 is –1 < x ≤ 3.

2.   To solve two simultaneous linear inequalities is to find a single equivalent inequality which satisfies both inequalities.
 

6.3.2 Practising Critical and Analytical Thinking when Selecting Processed Food (Structured Questions)


Question 1:
Diagram 1 shows a labelled container of a processed food.


(a) Based on Diagram 1, identify two chemicals written on the label. [2 marks]

(b) Based on the label in Diagram 1, which chemical is used as a preservative? [1 mark]

(c) Name the method of food processing used in Diagram 1. [1 mark]

(d) What other information should be written on the label in Diagram 1 according to Food Regulations 1985?
Give two answers. [2 marks]


Answer:
(a)
1. Benzoic acid
2. Flavouring

(b)

Benzoic acid

(c)

Canning

(d)

- Name of manufacturer
- Address of manufacturer


11.2.2 Linear Equations II, PT3 Focus Practice


Question 6:
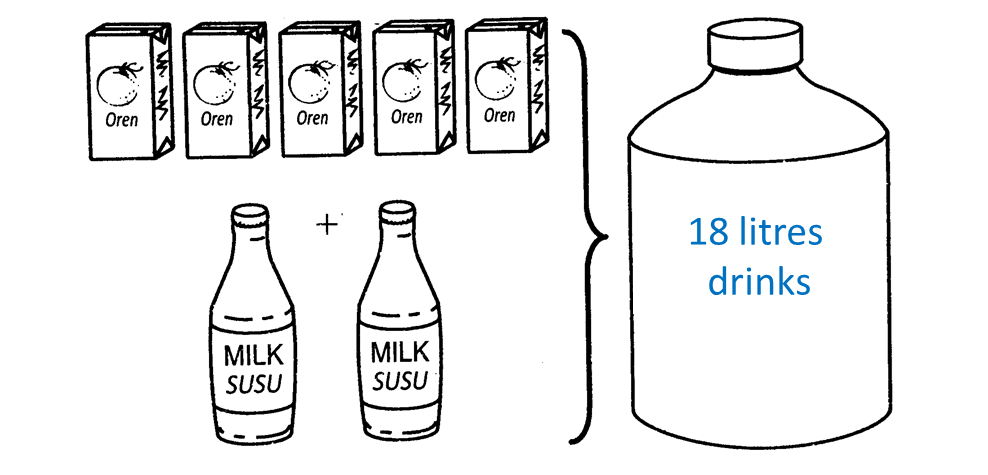
Diagram below shows 5 boxes of orange juice and 2 bottles of milk. Both orange juice and milk are mixed to produce 18 litres drink.


(a) Based on the above situation, write a linear equation.
(b) If 9 litres of drinks is produced by using 2 boxes of orange juice and 2 bottles of milk, find the volume, in litre, of orange juice in each box.

Solution:
Let j be the number of boxes of orange juice and m be the number of bottles of milk.
(a)
5j + 2m = 18

(b)
2j+2m=9  ............. (1)5j+2m=18 ............. (2)(2)(1):3j=9j=93=33 litres of orange juice in each box.