Question 1:
Diagram 1.1 and Diagram 1.2 show an experiment to study the collision between trolleys of different masses with a plasticine block.
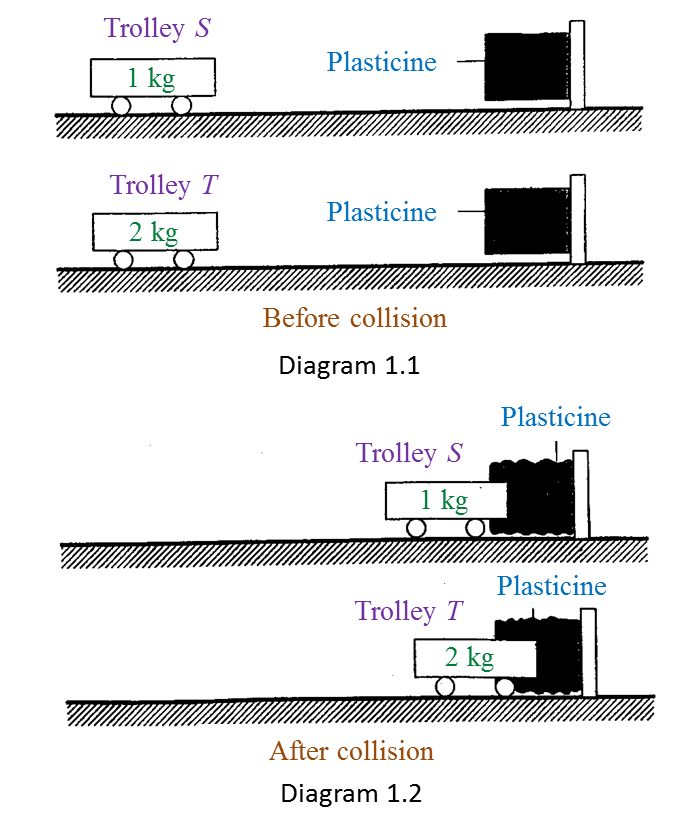
Both trolleys move with the same velocity.
(a) State the variables in this experiment.
(i) Manipulated variable [1 mark]
(ii) Responding variable [1 mark]
(b)(i) What can you observe about the plasticine block after the collision? [1 mark]
(ii) State
one inference that can be made based on the observation in (b)(i)
. [1 mark]
(c) State the hypothesis of this experiment. [1 mark]
Answer:
(a)(i) Mass of the trolley
(a)(ii) Depth of the dent on the plasticine block
(b)(i)
Trolley T produced a deeper dent on the plasticine block compared to the dent produced by trolley S after their collision with the plasticine block.
(b)(ii)
When a moving trolley with a bigger mass collides with a plasticine block, it produces a deeper dent on the plasticine block.
(c) The bigger the mass of a moving trolley which collides with a plasticine block, the deeper the dent which will be formed on the plasticine block.
Question 2:
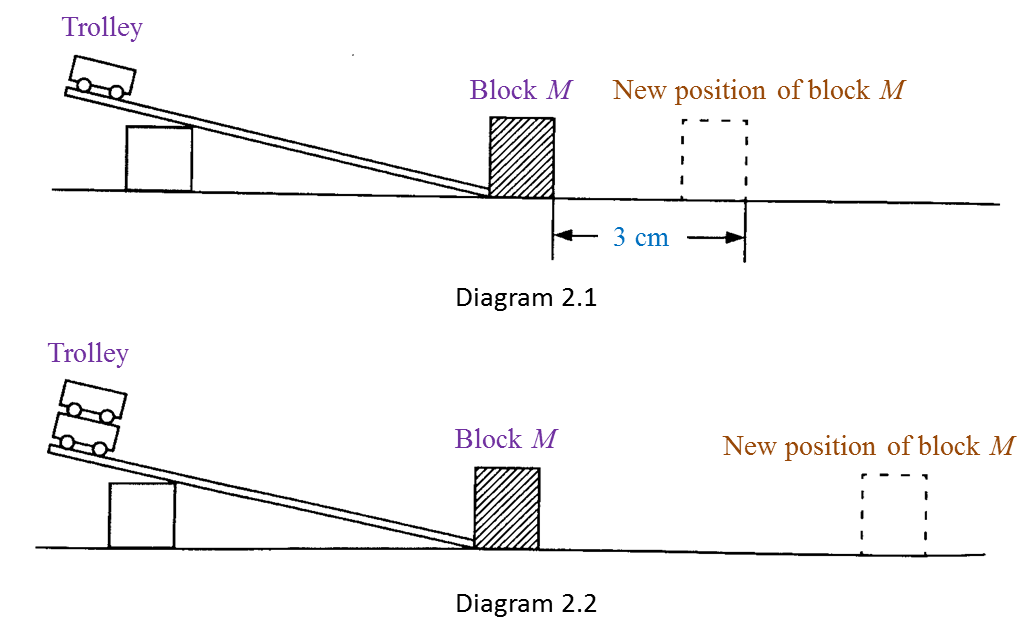
Diagram 2.1 shows an experiment to study the collision of a trolley with block
M. After collision, block
M is displaced to a new position.
The experiment is repeated using two trolleys as shown in Diagram 2.2.
The result of this experiment is shown in Table below.
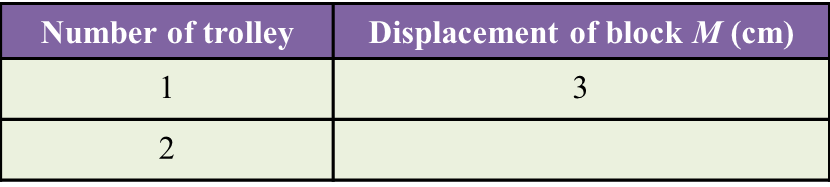
(a) Measure the displacement of block
M after the collision in Diagram 2.2. [1 mark]
(b) State
one observation about displacement of block
M in diagram 2.1 and 2.2
. [1 mark]
(c) State the variables in this experiment.
(i) Constant variable [1 mark]
(ii) Manipulated variable [1 mark]
(d) Predict the displacement of block
M if three trolleys are used. [1 mark]
Answer:
(a) 6 cm
(b) The displacement of block
M increases when the number of trolley increases.
(c)(i) Length and slope of runway, mass of block
M.
(c)(ii) The number of trolley used
(d) 9 cm
 Figure 1.1
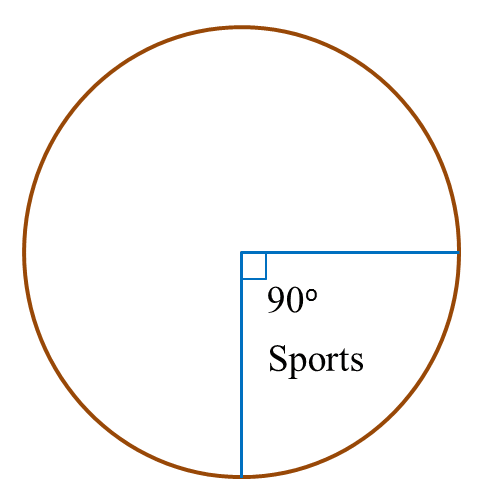
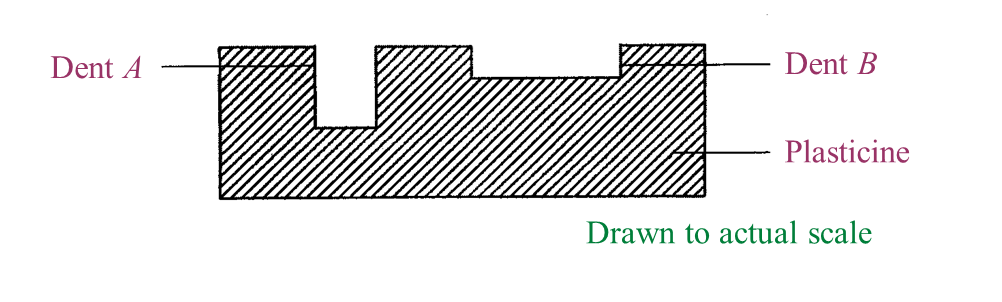 Figure 1.2
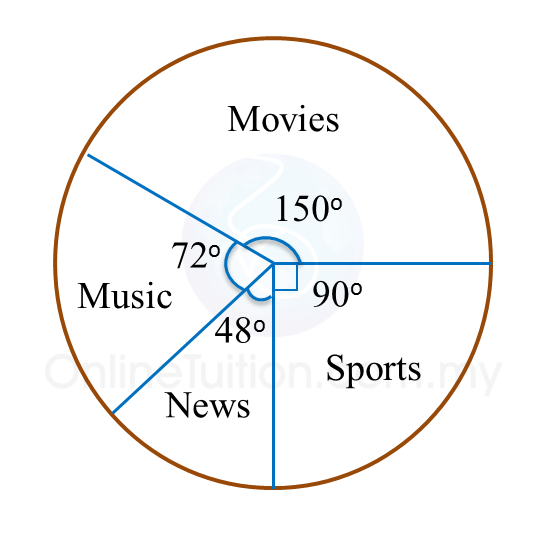
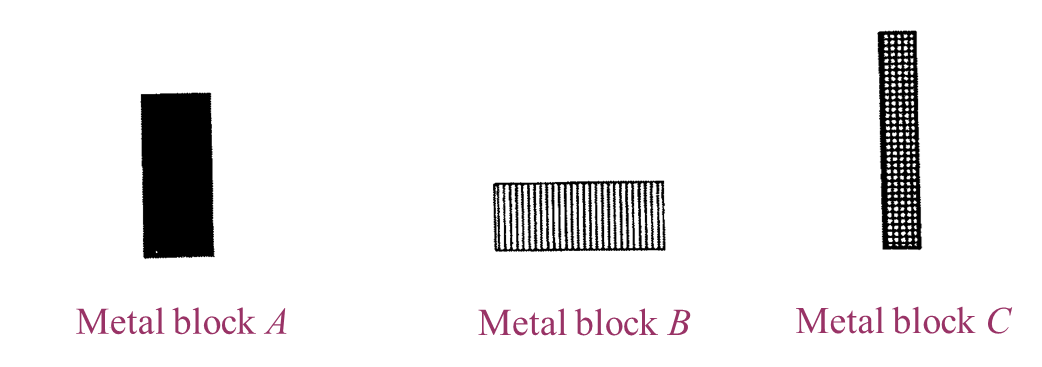 Figure 1.3
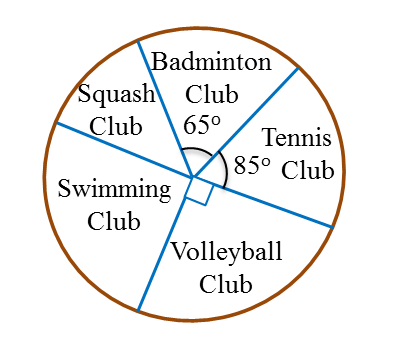

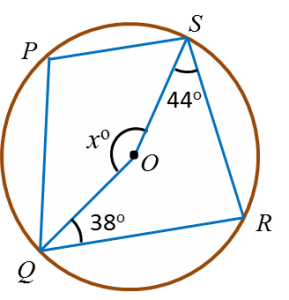
 Find the value of x.
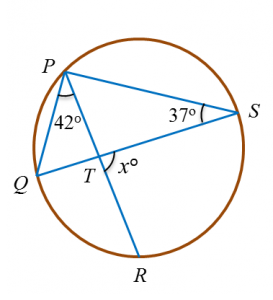
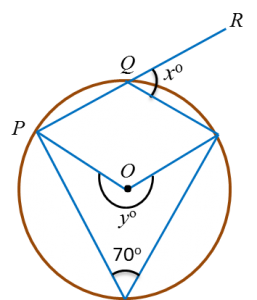
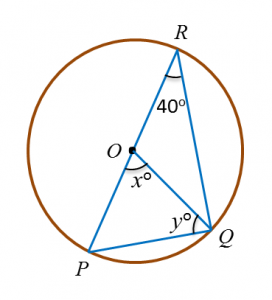
 Find the value of x and of y.
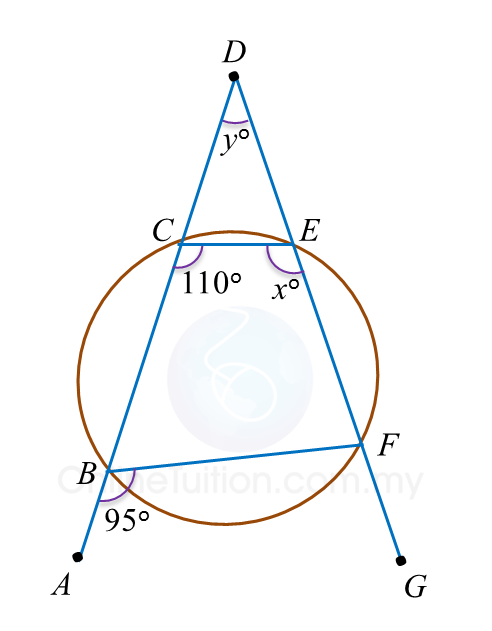