Question 4:
Diagram below is a pie chart which represents the relative amount of the ingredients P, Q, R and S, used in making biscuits.
(b)(i) Calculate the composite index for cost of making these biscuits in the year 2008 based on the year 2006.
(c) The cost of making these biscuits is expected to increase by 40 % from the year 2008 to the year 2010. Find the expected composite index for the year 2010 based on the year 2006.
Solution:
(a)
(b)(i)

(b)(ii)
(c)
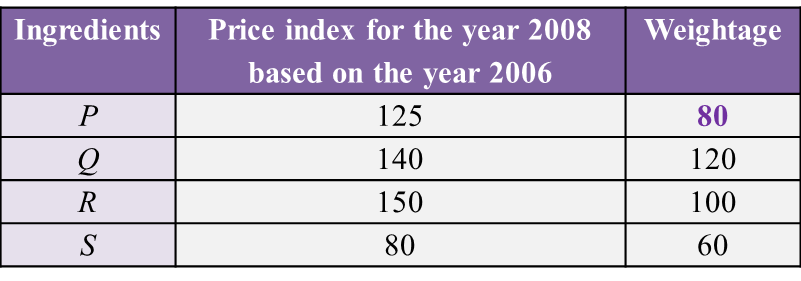
Table below shows the prices and the price indices for the four ingredients P, Q, R and S, used in making biscuits of a particular kind.


Diagram below is a pie chart which represents the relative amount of the ingredients P, Q, R and S, used in making biscuits.
(a) Find the value of x, y and z.
(b)(i) Calculate the composite index for cost of making these biscuits in the year 2008 based on the year 2006.
(ii) Hence, calculate the corresponding cost of making these biscuits in the year 2008 if the cost in the year 2006 was RM 585.
(c) The cost of making these biscuits is expected to increase by 40 % from the year 2008 to the year 2010. Find the expected composite index for the year 2010 based on the year 2006.
Solution:
(a)
(b)(i)

Sector P = 360o– 120o – 100o – 60o = 80o
(b)(ii)
(c)
