Nature of the Roots (Combination of Straight Line and the Curve)
When you have a straight line and a curve, you can solve the equation of the straight line and the curve simultaneously and form a quadratic equation, ax2 +bx + c = 0. The discriminant, gives information about the number of points of intersection.
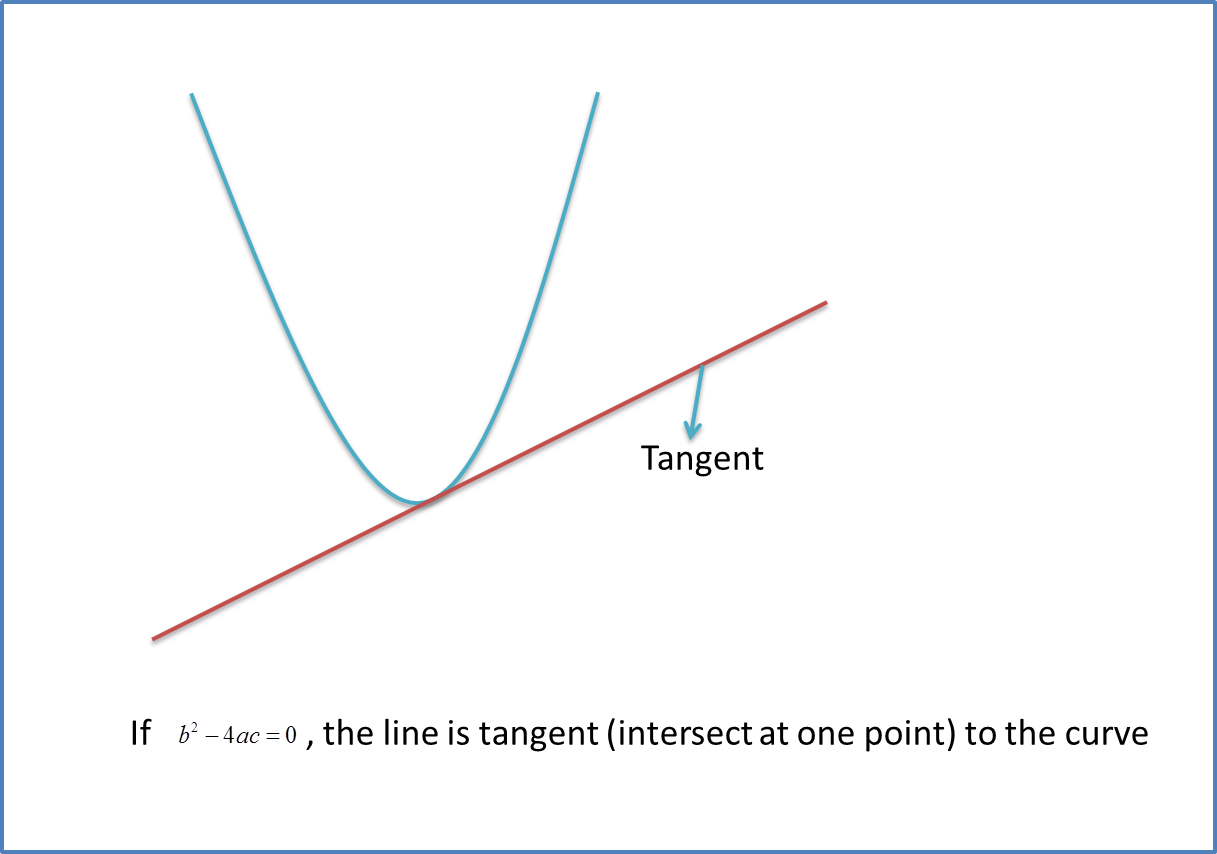
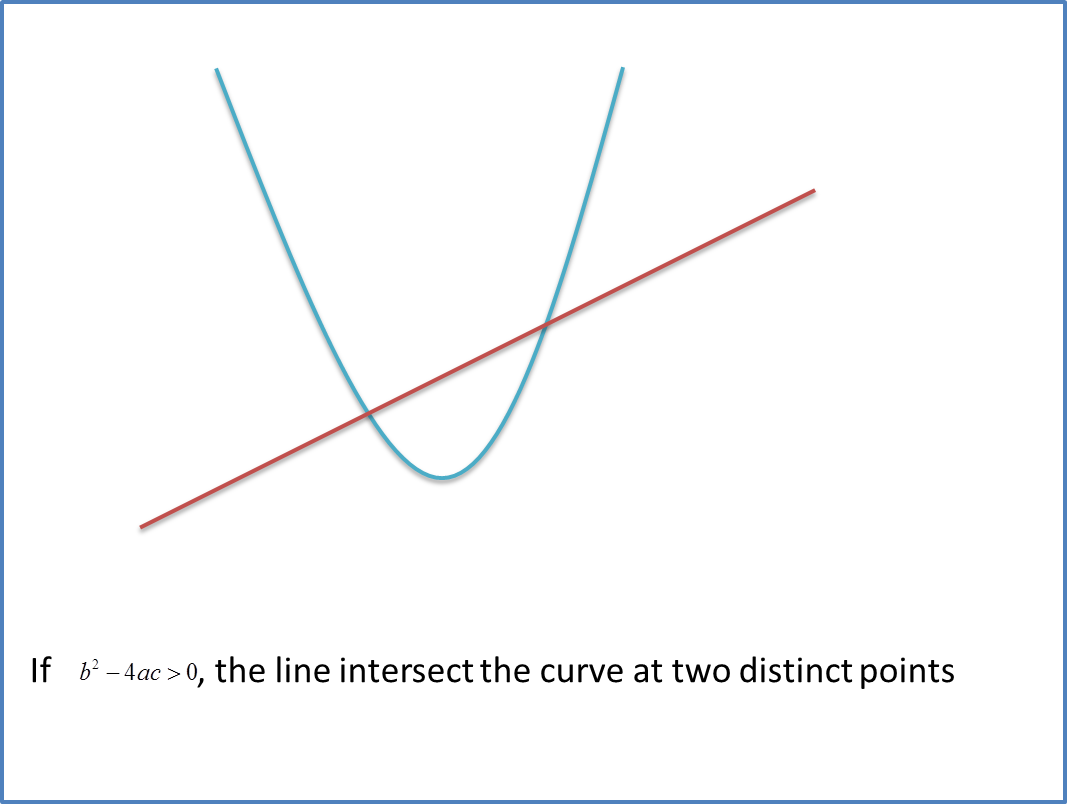
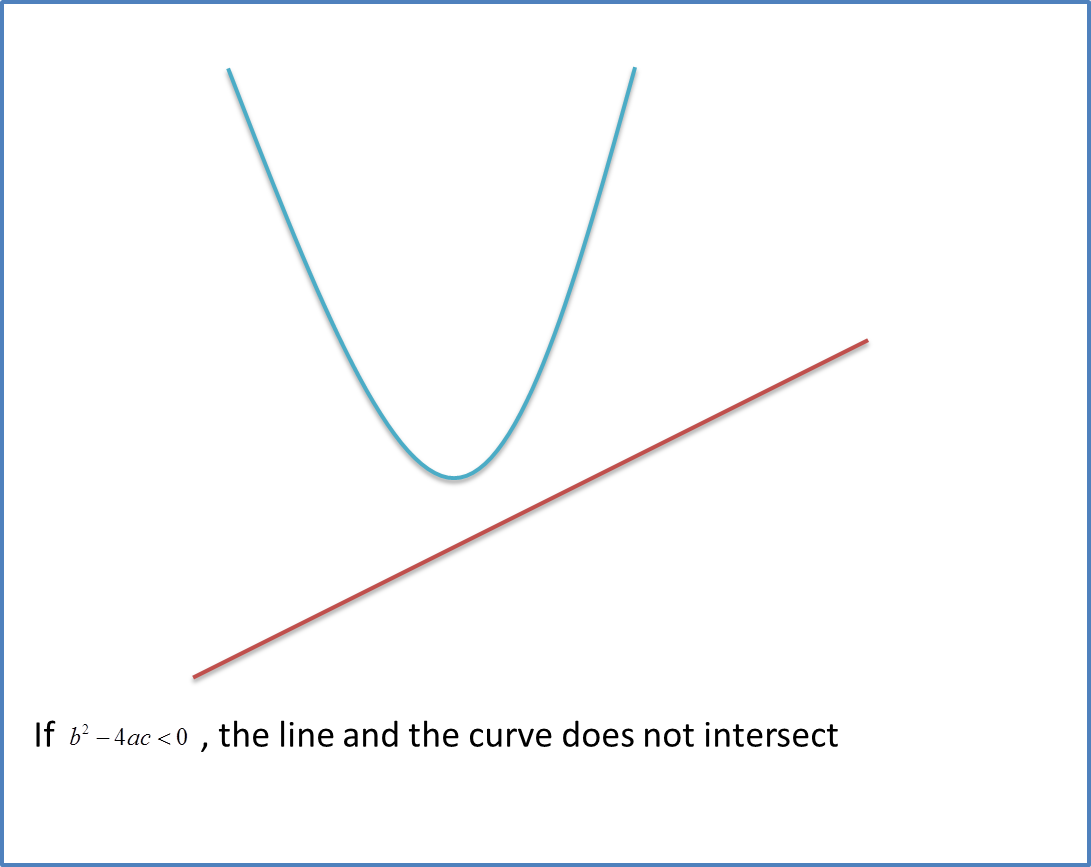
When you have a straight line and a curve, you can solve the equation of the straight line and the curve simultaneously and form a quadratic equation, ax2 +bx + c = 0. The discriminant, gives information about the number of points of intersection.


