2.4.1 Understanding Inertia

Mass

  1. Mass is defined as the amount of matter.
  2. The SI unit of mass is kilogram (kg)
  3. Mass is a scalar quantity.

Inertia

Inertia is the property of a body that tends to maintain its state of motion.

Newton's First Law

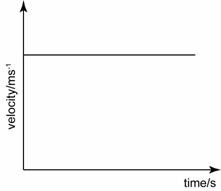
In the absence of external forces, an object at rest remains at rest and an object in motion continues in motion with a constant velocity (that is, with a constant speed in a straight line).

Jerking a Card


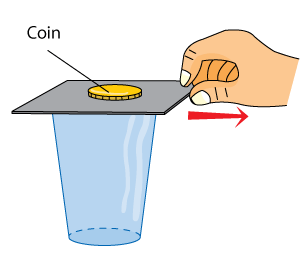
When the cardboard is jerked quickly, the coin will fall into the glass.

Explanation:
  • The inertia of the coin resists the change of its initial state, which is stationary.
  • As a result, the coin does not move with the cardboard and falls into the glass because of gravity.

Pulling a Book


When the book is pulled out, the books on top will fall downwards.
Explanation:

  • Inertia tries to oppose the change to the stationary situation, that is, when the book is pulled out, the books on top do not follow suit.

Pulling a Thread


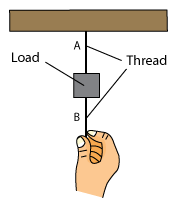
1. Pull slowly - Thread A will snap.
Explanation:

  • Tension of thread A is higher than string B.
  • Tension at A = Weight of the load + Pulling Force

2. Yank quickly - Thread B will snap.
Explanation:
  • The inertia of the load prevents the force from being transmitted to thread A, hence causing thread B to snap.

Passengers in a Vehicle

Phenomenon 1

When a car stop, passengers in the car will be thrown forward.

Explanation
When a car stops, the effect of inertia causing the passengers' body maintain their motion forward. As a result, the passengers are thrown forward.

Phenomenon 2

When a car accelerates, passengers in the car will be thrown backward.

Explanation
When a car accelerates and moves faster, the body of the passenger tends to maintain its state of motion due to the effect of inertia. As a result, the passenger is thrown backward as he moves slower than the car.


Larger Mass - Greater Inertia


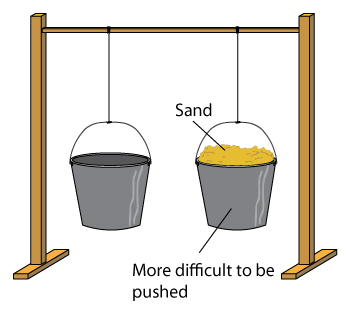
Bucket filled with sand is more difficult to be moved. It's also more difficult to be stopped from swinging.

Explanation:
  • Object with more mass offers a greater resistance to change from its state of motion.
  • Object with larger mass has larger inertia to resist the attempt to change the state of motion.

Empty Cart is Easier to be Moved


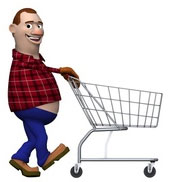
An empty cart is easier to be moved compare with a cart full with load. This is because a cart with larger mass has larger inertia to resist the attempt to change the state of motion.

Car with Higher Load is More Difficult to be Controlled


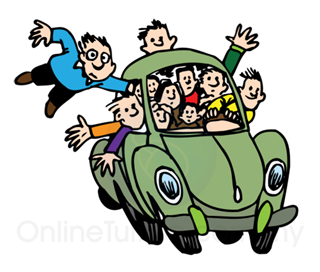
A car loaded with more passengers is more difficult to be controlled.

Explanation:
This is because, with more passenger, the mass increases, and hence increase the effect of inertia. This make the car  more difficult to change its speed, more difficult to stop,  and more difficult to change direction.
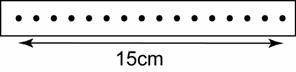
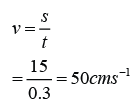
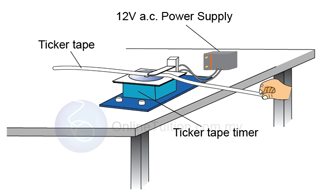
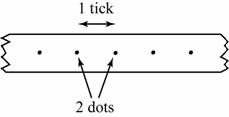
 

2.3.2 Velocity – Time Graph

  1. The gradient of the velocity-time gradient gives a value of the changing rate in velocity, which is the acceleration of the object.
  2. The area below the velocity-time graph gives a value of the object's displacement.

Analysing Velocity-Time Graph

  1. When analysing velocity-time graph, always keep in mind that the gradient of the graph is equal to the acceleration of the graph.
  2. If the gradient is constant, then the acceleration is constant. If the gradient increase, then the acceleration increase and etc.
  3. Table below shows a few cases of velocity-time graph for different types of motion.


Uniform velocity

Uniform acceleration

Increasing acceleration

Uniform deceleration

Decreasing acceleration

Converting a Velocity-Time graph to Acceleration-Time graph

  1. In order to convert a velocity-time graph to acceleration time graph, we need to find the gradient of the velocity time graph and plot it in the acceleration-time graph.
  2. The 5th and 6th videos below explain how to sketch an acceleration-time graph form a given velocity-time graph.

Free Falling

  1. Free falling is a motion under gravitational force as the only force acting on the moving object.
  2. The acceleration of a free falling object is always constant.
  3. On the surface of the earth, the acceleration of is equal to 10ms-2, and is named as gravitational acceleration.
  4. In SPM, you need to know the graphs of free falling of the following movement
    1. Launching object upward.
    2. Dropping Object from High Place
    3. Object Falling and Bounce Back

Launching Object Upward

  1. When you launch an object upward, its velocity decreases at a constant rate, hence it's a straight line with negative gradient in a velocity-time graph. 
  2. Since the velocity decreases at a constant rate, hence the acceleration is constant. Also, the acceleration is negative because the speed decreases in positive direction. Therefore, the acceleration graph is a horizontal line in the negative domain.
Motion

\

Velocity-Time Graph

Acceleration-Time Graph


Dropping Object from a High Place
  1. When an object drops from a high place, its velocity increases at a constant rate, hence it's a straight line with positive gradient in a velocity-time graph. 
  2. Since the velocity increases at a constant rate and the speed increases in positive direction hence the acceleration is constant and positive.
Motion

Velocity-Time Graph

Acceleration-Time Graph


Object Falling and Bounce Back
Motion

Velocity-Time Graph

Acceleration-Time Graph


2.3.1 Displacement-Time Graph

  1. There are 3 types of motion graph, namely
    1. the displacement-time graph
    2. the velocity-time graph
    3. the acceleration-time graph.
  2. When analysing a graph, it's important for us to know what's the physical quantity that's represented by the gradient of the graph and the area below the graph. 
  3. For example, in a displacement-time graph, the gradient represent the velocity of the moving object, whereas in a velocity-time graph, the gradient represent the acceleration of the moving object.
  4. It's also important for you to know how to find the gradient of a straight line from a graph.
  5. Sometime, you will be asked to convert a displacement-time graph to a velocity-time graph or convert a velocity-time graph to an acceleration-time graph.

Displacement - Time Graph


In a Displacement-Time Graph, the gradient of the graph is equal to the velocity of motion.

Analysing Displacement - Time Graph

  1. When analysing displacement-time graph, always remember that the gradient of the graph represents the velocity of the graph.
  2. Therefore, if the gradient of the graph is positive, the velocity is positive, and if the gradient of the graph is negative, the velocity is negative.
  3. A negative velocity indicates that the object moves in opposite direction.
  4. Table below shows the displacement-time graph of various motion.


Velocity = 0
This is a horizontal straight line, hence the gradient = 0.
Therefore, the velocity = gradient of the graph = 0, which means the object is stationary (does not move).


Uniform Velocity

The graph is a non-horizontal straight line, hence the gradient is not equal to 0. For a straight line, the gradient is constant, hence, the velocity of the moving object is uniform.

Negative Uniform Velocity
The graph is a non-horizontal straight line, with negative gradient. For straight line, the gradient must be constant. The negative value of gradient indicates that the object moves in opposite direction.
Therefore, this graph represents a motion with uniform velocity in opposite direction.

Increasing Velocity
The graph is a curve, shows that the gradient is not constant. The gradient increases over time, indicates that the velocity increases over time.

Decreasing Acceleration
The gradient decreases over time, shows that the velocity of the moving object decreases over time.


2.2.3 Finding Acceleration from Ticker Tape

Finding Acceleration

Acceleration of a motion can be determined by using ticker tape through the following equation:

Caution!:
t is time taken from the initial velocity to the final velocity.

Example:


The ticker-tape in figure above was produced by a toy car moving down a tilted runway. If the ticker-tape timer produced 50 dots per second, find the acceleration of the toy car.

Answer:
In order to find the acceleration, we need to determine the initial velocity, the final velocity and the time taken for the velocity change.

Initial velocity,

Final velocity,

Time taken for the velocity change,
t = (0.5 + 4 + 0.5) ticks = 5 ticks
t = 5 × 0.02s = 0.1s

Acceleration,


Example:


A trolley is pushed up a slope. Diagram above shows ticker tape chart that show the movement of the trolley. Every section of the tape contains 5 ticks. If the ticker-tape timer produced 50 dots per second, determine the acceleration of the trolley.

Answer:
In order to find the acceleration, we need to determine the initial velocity, the final velocity and the time taken for the velocity change.

Initial velocity,


Final velocity

Time taken for the velocity change,
t = (2.5 + 5 + 5 + 5 + 2.5) ticks = 20 ticks
t = 20 × 0.02s = 0.4s

Acceleration,


2.2.2 Finding Velocity from Ticker Tape

Finding Velocity

Velocity of a motion can be determined by using ticker tape through the following equation:

Caution!:
t is time taken from the first dot to the last dot of the distance measured.

Example:

Diagram above shows a strip of ticker tape that was pulled through a ticker tape timer that vibrated at 50 times a second. What is the
a. time taken from the first dot to the last dot?
b. average velocity of the object that is represented by the ticker tape?
Answer:
a. There are 15 ticks from the first dot to the last dot, hence

Time taken = 15 × 0.02s = 0.3s

b. Distance travelled = 15cm


2.2.1 Ticker Tape

Ticker Tape Timer


  1. A ticker tape timer consists of an electrical vibrator which vibrates 50 times per second. 
  2. This enables it to make 50 dots per second on a ticker-tape being pulled through it. 
  3. The time interval between two adjacent dots on the ticker-tape is called one tick. 
  4. One tick is equal to 1/50 s or 0.02 s.

Example:
Find the number of ticks and the time interval between the first dot and the last dot on each of the ticker tapes below. The frequency of the ticker timer is equal to 50Hz.
a.


b.


c.


Answer:
a. Number of ticks = 15, time interval = 15 x 0.02s = 0.3s

b. Number of ticks = 5, time interval = 5 x 0.02s = 0.1s

c. Number of ticks = 8, time interval = 8 x 0.02s = 0.16s

The distance between dots on a ticker tape

  1. The distance between two adjacent dots on a ticker-tape represents the displacement of the object in a tick (0.02 s).
  2. If the object moves quickly, the dots are far apart. If the object moves slowly, the dots are close to each other. 
  3. Figure below shows the ticker-tapes produced by a fast and a slow-moving object.

Ticker-tape charts

  1. We can construct a ticker-tape charts by cutting the ticker-tape into length with an equal number of dots on each length and sticking the length side by side on a graph paper, in the same order that they were on the whole tape.
  2. The diagram below shows an example of ticker-tape chart. There are 10 ticks on each length. This means that each length represents a time interval of 0.2s.
  3. Ticker-tape charts are very useful in analyzing the motion of an object.

Analysing Ticker Tape

Uniform Velocity


  • The distance of the dots is equally distributed.
  • All lengths of tape in the chart are of equal length.
  • The object is moving at a uniform velocity.

Uniform Acceleration


  • The distance between the dots increases uniformly.
  • The length of the strips of tape in the chart increase uniformly.
  • The velocity of the object is increasing uniformly, i.e. the object is moving at a constant acceleration.

Uniform Deceleration


  • The distance between the dots decreases uniformly.
  • The length of the strips of tape in the chart decreases uniformly.
  • The velocity of the object is decreasing uniformly, i.e. the object is decelerating uniformly.


2.1.4 Equation of Motion

Equation of Uniform Acceleration

Most of the motion problems can be solved by the following equations. Therefore, make sure that you memorise all of them.


How we know when to use the equation?


There are 3 types of motion:

  • motion with uniform velocity
  • motion with uniform acceleration
  • motion with changing acceleration
The 4 equations are used when the motion is uniform acceleration.

Motion with changing acceleration is not in SPM Physics syllabus. It will be discussed in Form 5 add maths.

Example 1:
An object accelerates from stationary with the acceleration of 4 ms-2. What is the velocity of the object after 7s?

Answer:
It's advisable to list down all the information that we have.

Initial velocity, u = 0 (Because the motion start from stationary)
Acceleration, a = 4 ms-2
Time taken, t = 7s
Final velocity, v = ?

The displacement, s, is not involved, hence we select the equation (v = u + at) to solve the problem.


Example 2
A car is moving with velocity 5ms-1 reaches a velocity of 25ms-1 in 5s. What is the acceleration of the car?

Answer:
It's advisable to list down all the information that we have.

Initial velocity, u = 5ms-1
Final velocity, v = 25ms-1
Time taken, t = 5s
Acceleration, a = ?

The displacement, s, is not involved, hence we select the equation (v = u + at) to solve the problem.


Example 3
A cyclist riding at a speed of 40 ms-1 braked with uniform acceleration and stopped in 40m. How long did he take to stop?

Answer:
It's advisable to list down all the information that we have.

Initial velocity, u = 40 ms-1
Final velocity, v = 0 (Because the cyclist stop)
Displacement, s = 40m
Time taken, t = ?

The acceleration, a, is not involved, hence we select the equation to solve the problem.


Example 4
A car is accelerated at 4 ms-2 from an initial velocity of 5 ms-1 for 10 seconds. What is the distance traveled by the car?

Answer:
It's advisable to list down all the information that we have.

Acceleration, a = 4 ms-2
Initial velocity, u = 5
Time taken, t = 10s
Displacement, s = ?

The final velocity, v, is not involved, hence we select the equation to solve the problem.


Example 5
A car accelerates from 4 ms-1 reaches a velocity of 28 ms-1 after traveling for 64m. What is the deceleration of the car?

Answer:
It's advisable to list down all the information that we have.

Initial velocity, u = 4 ms-1
Final velocity, v = 28 ms-1
Displacement, s = 64m
Acceleration, a = ?

The time taken, t, is not involved, hence we select the equation v² = u² + 2as to solve the problem.


2.1.3 Acceleration

  1. Acceleration is defined as the rate of velocity change. It is a measure of how fast the velocity change.
  2. Acceleration is a vector quantity.
  3. The unit of acceleration is ms-2.
  4. An object moving with a velocity that is decreasing is said to be experiencing deceleration.

Equation


Example:
A car travels from a stationary position and reach a velocity of 36 ms-1 in 8 seconds. What is the acceleration of the car?
Answer:

Initial velocity, u = 0
Final velocity, v = 36 ms-1
Time taken, t = 8s
Acceleration, a = ?
 

Positive and Negative Sign of Acceleration

  1. Acceleration is a vector quantity, its sign (positive or negative) is determined by
    1. its direction
    2. rate of change of the speed
  2. If the speed of an object is increasing, the rate of change of the speed is positive, and if the speed of an object is decreasing, the rate of change of the speed is negative.
  3. Table below shows the positive/negative sign of acceleration related to the direction and rate of change of speed.
    1. When both the direction and change of speed are positive, the acceleration is positive.
    2. When the direction is positive and the change of speed is negative (speed decrease), then the acceleration is negative. This is equivalent to deceleration.
    3. When the direction is negative and the change of speed is positive (speed increase), then the acceleration is also negative. Since the speed increase, hence this is not deceleration.
    4. When both the direction and change of speed are negative, the acceleration is positive.

Additional Notes

  1. An object that experiences changes in velocity is said to have acceleration.
  2. Changes of velocity can be
    1. change of speed
    2. change of direction
  3. An object traveling with a constant acceleration, a, if the velocity changes at a constant rate.


2.1.2 Speed and Velocity

Speed

  1. Speed is defined as the rate of change in distance. It is a measure of how fast the distance change in a movement.
  2. Speed is a scalar quantity.
  3. The SI unit of speed is m/s (metre per second)

Equation of Speed


Velocity

  1. Velocity is define as the rate of displacement change. It is the measure of how fast the displacement change of a moving object.
  2. Velocity is a vector quantity.
  3. The unit of velocity is m/s (metre per second)

Equation of velocity


Positive or Negative Sign of Velocity

  1. In velocity, the positive/negative sign indicates direction.
  2. You can take any direction as positive and the opposite as negative.
  3. For a linear motion, normally we take the motion to the right as positive and hence the motion to the left as negative.

Comparing Speed and Velocity


2.1.1 Distance and Displacement

  1. Kinematics is the research regarding the types of movement of an object without referring to the forces that cause the movement of the object.
  2. Movement along a straight line is called linear motion.
  3. Under linear motion, we study the
    1. distance and displacement
    2. speed and velocity
    3. acceleration
  4. and the relationship between them.

Distance

Definition
The distance traveled by an object is the total length that is traveled by that object.

SI unit: meter (m) Quantity: Scalar

Displacement

Definition
Displacement of an object from a point of reference, O is the shortest distance of the object from point O in a specific direction.

SI unit: meter (m) Quantity: Vector

Example:


The distance of point B from the origin O is 100m. The distance of point A from the origin O is also 100m.
The displacement of point B from the origin O is +100m. The distance of point A from the origin O is -100m. The + and – sign show the direction of the displacement.

Example:


Adli go to work by motorcycle everyday as shown in the diagram above. The distance that Adli travels from his house to the factory is 200m. The displacement of Adli from his house after arriving at the factory is 120m.