Question 2 (10 marks):
Use a graph to answer this question.
Table 1 shows the values of two variables, x and y, obtained from an experiment.
The variables x and y are related by the equation y−√h=hkx , where h and k are constants.
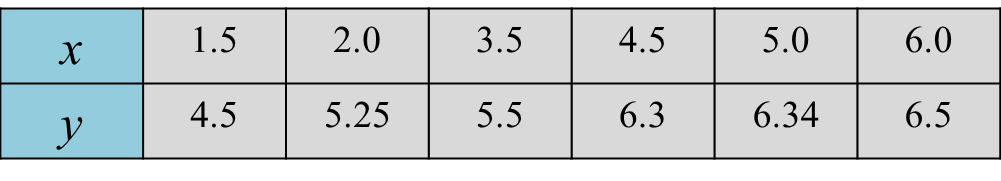
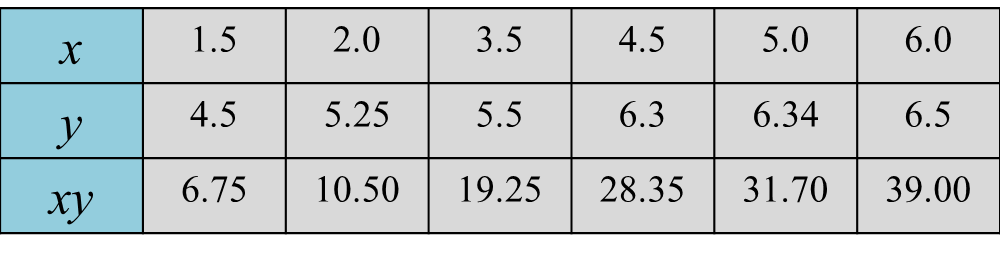
(a) Plot xy against x, using a scale of 2 cm to 1 unit on the x-axis and 2 cm to 5 units on the xy-axis.
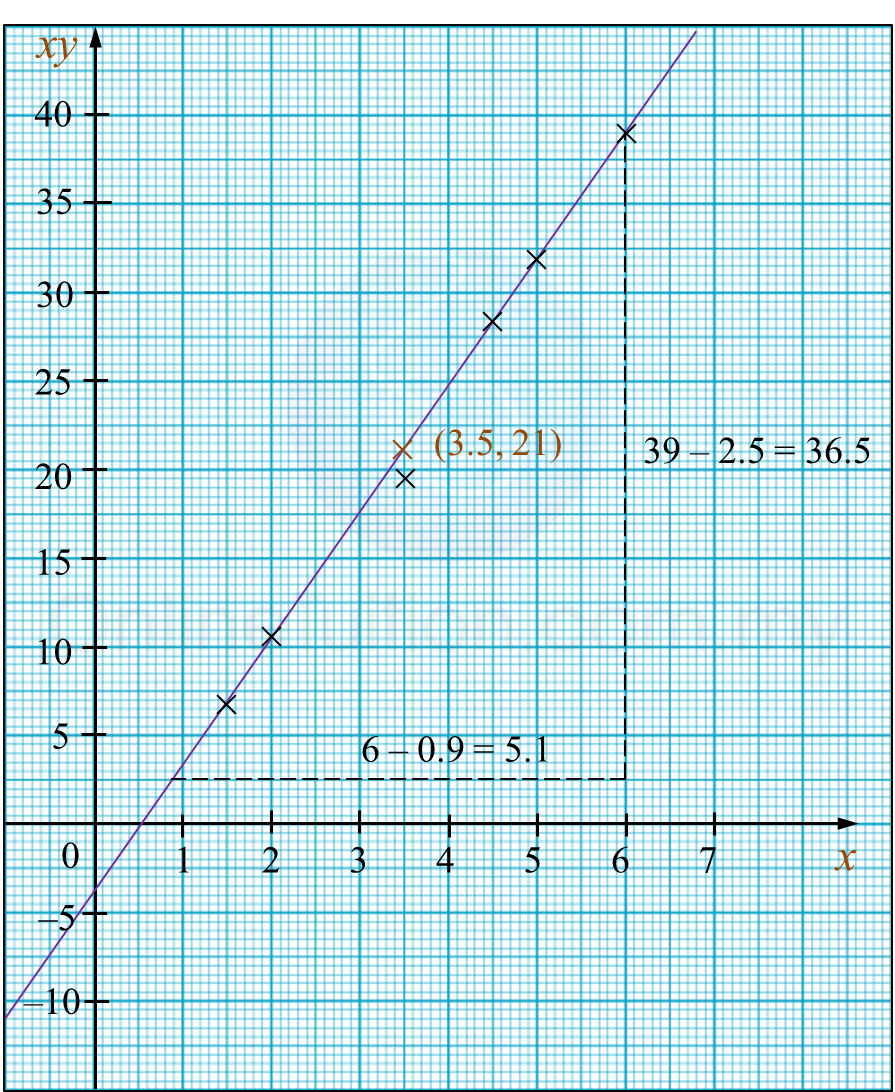
Hence, draw the line of best fit.
(b) Using the graph in 2(a), find
(i) the value of h and of k,
(ii) the correct value of y if one of the values of y has been wrongly recorded during the experiment.
Solution:
(a)
(b)
y−√h=hkxxy−√hx=hkxy=√hx+hkY=mX+CY=xy, m=√h, C=hk
(b)(i)
m=36.55.1√h=36.55.1√h=7.157h=51.22C=−4hk=−4k=−4hk=−451.22k=−0.0781
(b)(ii)
xy=213.5y=21y=213.5=6.0Correct value of y is 6.0.
Use a graph to answer this question.
Table 1 shows the values of two variables, x and y, obtained from an experiment.
The variables x and y are related by the equation y−√h=hkx , where h and k are constants.
(a) Plot xy against x, using a scale of 2 cm to 1 unit on the x-axis and 2 cm to 5 units on the xy-axis.
Hence, draw the line of best fit.
(b) Using the graph in 2(a), find
(i) the value of h and of k,
(ii) the correct value of y if one of the values of y has been wrongly recorded during the experiment.
Solution:
(a)
(b)
y−√h=hkxxy−√hx=hkxy=√hx+hkY=mX+CY=xy, m=√h, C=hk
(b)(i)
m=36.55.1√h=36.55.1√h=7.157h=51.22C=−4hk=−4k=−4hk=−451.22k=−0.0781
(b)(ii)
xy=213.5y=21y=213.5=6.0Correct value of y is 6.0.