Question 9:
Diagram below shows the speed-time graph for the movement of an object for a period of 34 seconds.

(a) State the duration of time, in seconds, for which the object moves with uniform speed.
(b) Calculate the rate of change of speed, in ms-2, of the object for the first 8 seconds.
(c) Calculate the value of u, if the average of speed of the object for the last 26 seconds is 6 ms-1.
Solution:
(a) Duration of time = 26s – 20s = 6s
(b)Rate of change of speed for the first 8 seconds=10−60−8=−48=−12 ms−2
(c)Speed=DistanceTime(12×12×(6+u))+(6×u)+(12×8×u)26=6 36+6u+6u+4u=156 16u=120 u=7.5 ms−1
Diagram below shows the speed-time graph for the movement of an object for a period of 34 seconds.

(a) State the duration of time, in seconds, for which the object moves with uniform speed.
(b) Calculate the rate of change of speed, in ms-2, of the object for the first 8 seconds.
(c) Calculate the value of u, if the average of speed of the object for the last 26 seconds is 6 ms-1.
Solution:
(a) Duration of time = 26s – 20s = 6s
(b)Rate of change of speed for the first 8 seconds=10−60−8=−48=−12 ms−2
(c)Speed=DistanceTime(12×12×(6+u))+(6×u)+(12×8×u)26=6 36+6u+6u+4u=156 16u=120 u=7.5 ms−1
Question 10 (6 marks):
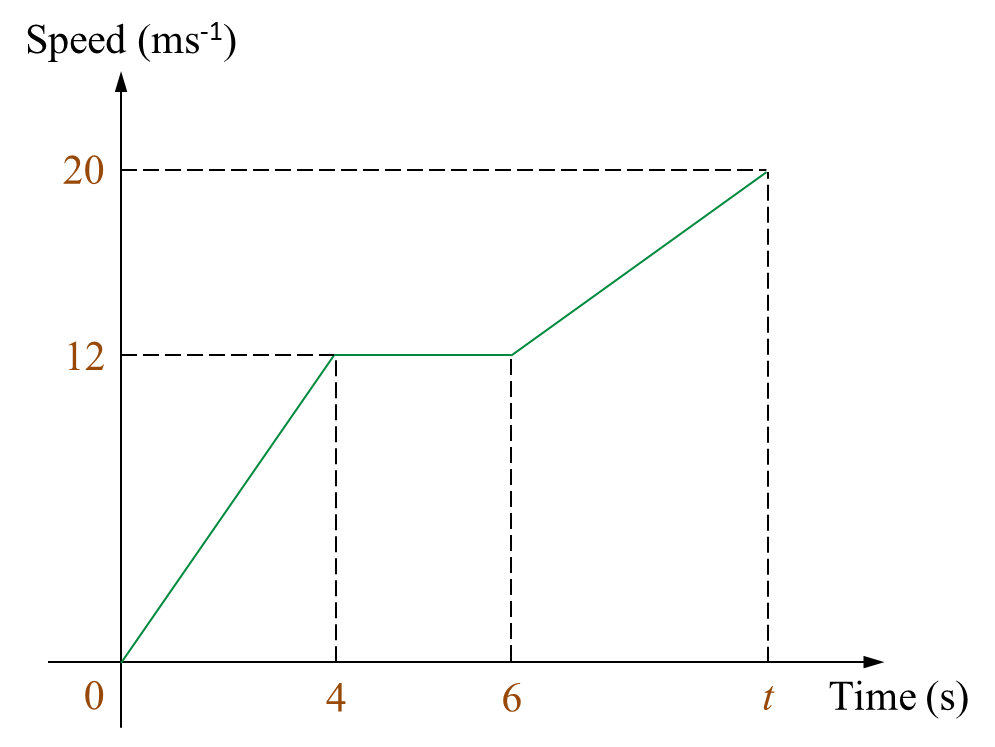
Diagram 11 shows the speed-time graph for the movement of a particle for a period of t seconds.
 Diagram 11
(a) State the uniform speed, in ms-1, of the particle.
(b) Calculate the rate of change of speed, in ms-2, of the particle in the first 4 seconds.
(c) Calculate the value of t, if the distance travelled in the first 4 seconds is half of the distance travelled from the 6th second to the tth second.
Solution:
(a)
Uniform speed of the particle = 12 ms-1
(b)
Rate of change of speed of particle=124=3 ms−2
(c)
Distance travelled in the first 4 seconds =12(Distance travelled from the 6th second to tth second)12×4×12=12[12(12+20)(t−6)]24=12[16(t−6)]24=8(t−6)24=8t−483=t−6t=9
Diagram 11 shows the speed-time graph for the movement of a particle for a period of t seconds.
 Diagram 11
(a) State the uniform speed, in ms-1, of the particle.
(b) Calculate the rate of change of speed, in ms-2, of the particle in the first 4 seconds.
(c) Calculate the value of t, if the distance travelled in the first 4 seconds is half of the distance travelled from the 6th second to the tth second.
Solution:
(a)
Uniform speed of the particle = 12 ms-1
(b)
Rate of change of speed of particle=124=3 ms−2
(c)
Distance travelled in the first 4 seconds =12(Distance travelled from the 6th second to tth second)12×4×12=12[12(12+20)(t−6)]24=12[16(t−6)]24=8(t−6)24=8t−483=t−6t=9