Question 11 (6 marks):
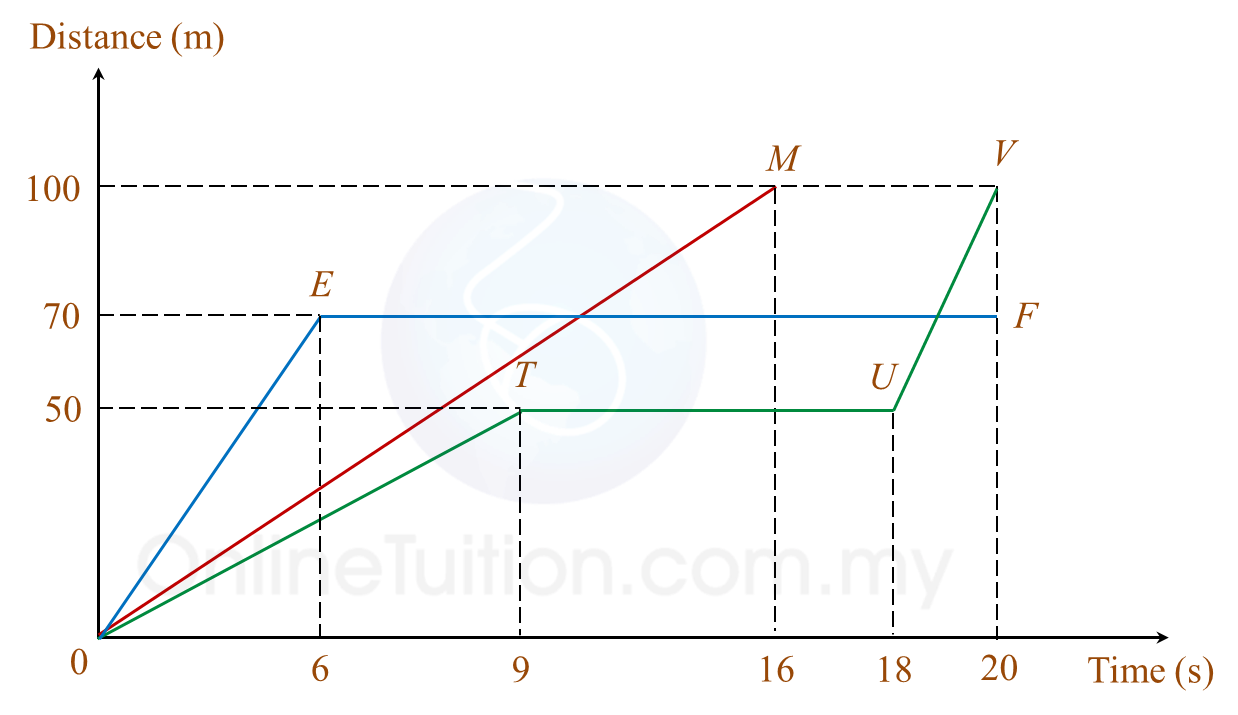
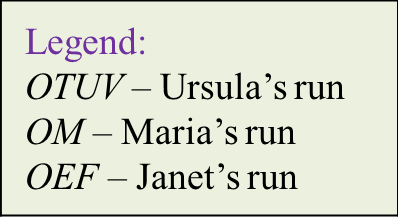
Diagram 6 shows the distance-time graph of Ursula, Janet and Maria in a 100 m race.
 Diagram 6

(a) Who won the race?
(b) During the race, Ursula slipped and fell over. After that, she continued her run.
State the duration, in seconds, before Ursula continued her run.
(c) During the race, Janet was injured and she stopped running.
State Janet's distance, in m, from the finishing line when she stopped running.
(d) Calculate the average speed, in ms-1, of Ursula.
Solution:
(a)
Maria won the race: 100 km in 16 seconds.
(b)
Duration before Ursula continued her run from slipping and falling over
= 18 seconds – 9 seconds
= 9 seconds
(c)
Janet's distance from the finishing line when she stopped running
= 100 m – 70 m
= 30 m
(d)
Average speed=DistanceTime =100 m20 s =5 ms−1Average speed of Ursula=5 ms−1
Diagram 6 shows the distance-time graph of Ursula, Janet and Maria in a 100 m race.
 Diagram 6
(a) Who won the race?
(b) During the race, Ursula slipped and fell over. After that, she continued her run.
State the duration, in seconds, before Ursula continued her run.
(c) During the race, Janet was injured and she stopped running.
State Janet's distance, in m, from the finishing line when she stopped running.
(d) Calculate the average speed, in ms-1, of Ursula.
Solution:
(a)
Maria won the race: 100 km in 16 seconds.
(b)
Duration before Ursula continued her run from slipping and falling over
= 18 seconds – 9 seconds
= 9 seconds
(c)
Janet's distance from the finishing line when she stopped running
= 100 m – 70 m
= 30 m
(d)
Average speed=DistanceTime =100 m20 s =5 ms−1Average speed of Ursula=5 ms−1