Question 8 (12 marks):
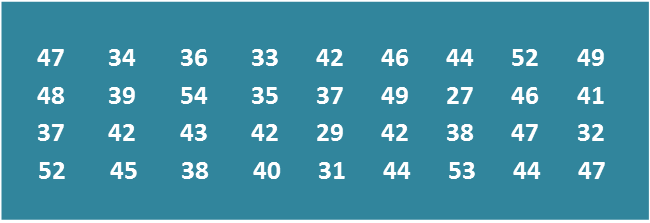
Diagram shows the marks obtained by a group of 36 students in a Mathematics test.
 Diagram
(a) Based on the data in Diagram, complete Table in the answer space.
(b) Based on the Table, calculate the estimated mean mark of a student.
(c) For this part of the question, use graph paper.
By using the scale of 2 cm to 5 marks on the horizontal axis and 2 cm to 1 student on the vertical axis, draw a frequency polygon for the data.
(d) Based on the frequency polygon in 8(c), state the number of students who obtained more than 40 marks.
Answer:
 Table
Table
Solution:
(a)

(b)
Estimated mean mark=Total [Frequency×midpoint]Total frequency=2(28)+5(33)+7(38)+10(43)+ 8(48)+4(53)2+5+7+10+8+4=151336=42.03
(c)

(d)
Number of students who obtained more than 40 marks
= 10 + 8 + 4
= 22 students
Diagram shows the marks obtained by a group of 36 students in a Mathematics test.
Diagram(a) Based on the data in Diagram, complete Table in the answer space.
(b) Based on the Table, calculate the estimated mean mark of a student.
(c) For this part of the question, use graph paper.
By using the scale of 2 cm to 5 marks on the horizontal axis and 2 cm to 1 student on the vertical axis, draw a frequency polygon for the data.
(d) Based on the frequency polygon in 8(c), state the number of students who obtained more than 40 marks.
Answer:
TableSolution:
(a)
(b)
Estimated mean mark=Total [Frequency×midpoint]Total frequency=2(28)+5(33)+7(38)+10(43)+ 8(48)+4(53)2+5+7+10+8+4=151336=42.03
(c)
(d)
Number of students who obtained more than 40 marks
= 10 + 8 + 4
= 22 students