Question 9 (12 marks):
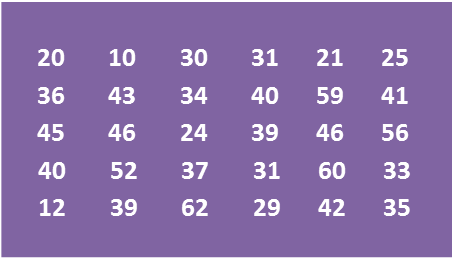
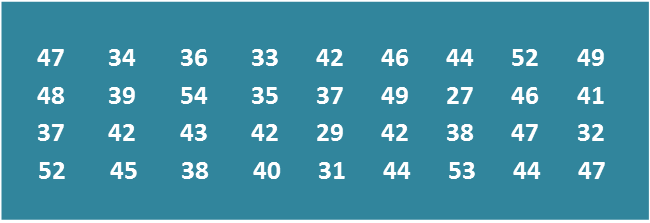
The data in the Diagram shows the mass, in g, of 30 strawberries plucked by a tourist from a farm.
 Diagram
(a) Based on the Diagram, complete Table 3 in the answer space.
(b) Based on Table, calculate the estimated mean mass of a strawberry.
(c) For this part of the question, use graph paper.
By using the scale of 2 cm to 10 g on the horizontal axis and 2 cm to 1 strawberry on the vertical axis, draw a histogram for the data.
(d) Based on the histogram drawn in 14(c), state the number of strawberries with the mass of more than 50 g.
Answer:

Solution:
(a)

(b)
Estimated mean mass=Total [midpoint×frequency]Total frequencies=2(14.5)+5(24.5)+10(34.5)+8(44.5)+3(54.5)+2(64.5)2+5+10+8+3+2=114530=38.17
(c)

(d)
Number of strawberries with the mass more than 50 g
= 3 + 2
= 5
The data in the Diagram shows the mass, in g, of 30 strawberries plucked by a tourist from a farm.
Diagram(a) Based on the Diagram, complete Table 3 in the answer space.
(b) Based on Table, calculate the estimated mean mass of a strawberry.
(c) For this part of the question, use graph paper.
By using the scale of 2 cm to 10 g on the horizontal axis and 2 cm to 1 strawberry on the vertical axis, draw a histogram for the data.
(d) Based on the histogram drawn in 14(c), state the number of strawberries with the mass of more than 50 g.
Answer:
Solution:
(a)
(b)
Estimated mean mass=Total [midpoint×frequency]Total frequencies=2(14.5)+5(24.5)+10(34.5)+8(44.5)+3(54.5)+2(64.5)2+5+10+8+3+2=114530=38.17
(c)
(d)
Number of strawberries with the mass more than 50 g
= 3 + 2
= 5
 Diagram
 Table
Table


 Diagram 11
 Diagram 12