7.5 SPM Practice (Long Questions)


Question 1:

All the cards written with the letters from the word ‘INTERNATIONAL’ are put into a box.
Two cards are drawn at random from the box, one after another, without replacement. Calculate the probability that

(a)
the first card drawn has a letter N and the second card drawn has a letter I.
(b) the two cards drawn have the same letter. 

Solution:

(a)
There are three cards with the letter ‘N’ and two card with letter ‘I’.
P (the first card drawn has a letter N and the second card drawn has a letter I)
= 3 13 × 2 ( 13 1 ) = 3 13 × 2 12 = 1 26

(b)

P (the two cards drawn have the same letter)
= P (II or NN or TT or AA)
= P (II) + P (NN) + P (TT) + P (AA)
=( 2 13 × 1 12 )+( 3 13 × 2 12 )+( 2 13 × 1 12 )+( 2 13 × 1 12 )    There are 3 letter 'N' out of 13 letters = 2 156 + 6 156 + 2 156 + 2 156 = 12 156 = 1 13


Question 2:
During National Day celebration, a group of 8 boys and 5 girls from a school are taking part in a singing competition. Each day, two pupils are chosen at random to perform special skill.

(a) Calculate the probability that both pupils chosen to perform special skill are boys.

(b) Two boys were chosen to perform special skill on the first day. They are exempted from performing special skill on the second day.
  Calculate the probability that both pupils chosen to perform special skill on the second day are of the same gender.

Solution:

(a)
P (both pupils are boys) = P ( B B ) = 8 13 × 7 12 = 7 24

(b)

P (both pupils are of the same gender) = P ( B B ) + P ( G G ) = ( 6 11 × 5 10 ) + ( 5 11 × 4 10 ) 11 pupils left in the group to perform special skill on the second day after two boys were exempted . = 3 11 + 2 11 = 5 11

7.1 Probability of an Event


7.1 Probability of an Event
The probability of an event A, P(A) is given by

P ( A ) = Number of times event A occurs Number of trials P ( A ) = n ( A ) n ( S ) where 0 P ( A ) 1  

If P(A) = 0, then the event A will certainly not occur.
If P(A) = 1, then the event A is sure to occur.


Example 1:
A box contains 9 red pens and 13 blue pens. Tom puts another 4 red pens and 2 blue pens into the box. A pen is picked at random from the box. What is the probability that a red pen is picked?

Solution:
n(S) = 9 + 13 + 4 + 2 = 28
Let A = Event that a red pen is picked
n(A) = 9 + 4 = 13
P ( A ) = n ( A ) n ( S ) = 13 28


Example 2:
A bag contains 45 green cards and yellow cards. A card is picked at random from the bag. The probability that a green card is picked is 1 5 .  How many green cards must be added to the bag so that the probability of picking a green card becomes ½?

Solution:
n(S) = 45
Let
x = number of green cards in the bag.
A = Event of randomly picking a green card.
n(A) = x
P ( A ) = n ( A ) n ( S ) 1 5 = x 45 x = 45 5 x = 9

Let y is the number of green cards added to the bag.
9 + y 45 + y = 1 2
2 (9 + y) = 45 + y
 18 + 2y= 45 + y
2yy = 45 – 18
y = 27

6.2 Quantity Represented by the Area under a Graph (Part 1)


6.2 Quantity Represented by the Area under a Graph (Part 1)
1. In the speed-time graph,
(a) Quantity represented by the gradient of the graph is acceleration or the rate of change of speed.
(b) Quantity represented by the area under the graph is distance.


Example 1:
Calculate the distance of each of the following graphs.
(a)

Distance = Area under the speed-time graph = Area of a triangle
Distance = 1 2 × b a s e × h e i g h t = 1 2 × 7 × 6 = 21 m

(b)

Distance = Area under the speed-time graph = Area of a rectangle
Distance = Length × Breadth
= 6 × 4 = 24 m

(c)


Distance = Area under the speed-time graph = Area of a trapezium

Distance = 1 2 ( a + b ) h Area of trapezium = 1 2 × Sum of the two parallel sides × Height = 1 2 ( 4 + 6 ) × 8 = 40 m

6.1 Quantity Represented by the Gradient of a Graph (Part 2)


(B) Speed – Time Graph
1. The gradient of a speed-time graph is the rate of change of speed or acceleration.


2.


(a) From O to P: Gradient = positive → (Speed of object increasing or accelerating).

(b) 
From P to Q: Gradient = 0 → (Object is moving at uniform speed).

(c) 
From Q to R: Gradient = negative → (Speed of object decreasing or decelerating).


Example:


The diagram above shows the speed-time graph of a moving car for 5 seconds. Find
(a) the rate of speed change when the car travel from X to Y.
(b) the rate of speed change when the car travel from Y to Z.
 
Solution:
(a)
Rate of speed change when the car travels from X to Y
= Gradient
= y 2 y 1 x 2 x 1 = 5 20 4 0 = 15 4 ms 2 Negative gradient indicates that the speed is decreasing .

(b)
Rate of speed change when the car travels from Y to Z
= Gradient
= y 2 y 1 x 2 x 1 = 10 5 5 4 = 5 ms 2

6.3 SPM Practice (Long Questions)


Question 1:


The diagram above shows the distance-time graph of a moving particle for 5 seconds. Find
(a) the distance travel by the particle from the time 2 second to 5 second.
(b)   the speed of the particle for the first 2 seconds.

Solution:

(a)
Distance travel by the particle from the time 2 second to 5 second
= 20 – 15
= 5 m

(b)
The speed of the particle for the first 2 seconds
= Gradient 
= 15 0 2 0 = 7.5 ms 1


Question 2:


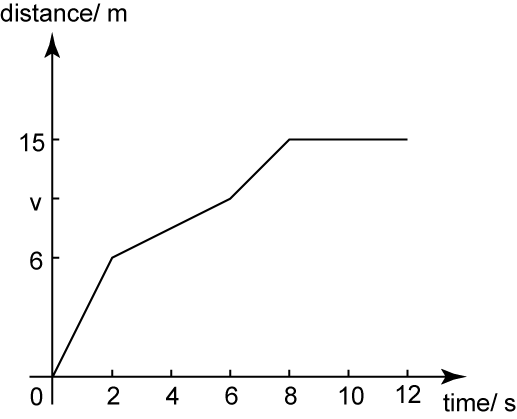
The diagram above shows the distance-time graph of a moving car for 12 seconds. Find
(a)    the value of v, if the average speed of the car for the first 6 seconds is 2 ms-1.
(b)   average speed of the car for the first 8 seconds.

Solution:

(a)
Average speed of the car for the first 6 seconds is 2 ms -1 Total distance travelled Total time taken =2 v 6 =2 v=12

(b)
Average speed of the car for the first 8 seconds = 15 8 =1.875 m s 1


6.3 SPM Practice (Long Questions)


Question 3:
Diagram below shows the distance-time graph for the journey of a train from one town to another for a period of 90 minutes.


(a) State the duration of time, in minutes, during which the train is stationery.
(b) Calculate the speed, in km h-1, of the train in the first 40 minutes.
(c) Find the distance, in km, travelled by the train for the last 25 minutes.

Solution:
(a) Duration the train is stationery = 65 – 40 = 25 minutes

(b) Speed of the train in the first 40 minutes = 15090 km 40 minutes = 60 km 40 60  h =90 km / h

(c) 90 – 0 = 90 km


Question 4:


The diagram above shows the speed-time graph of a moving particle for 10 seconds. From the graph above, find
(a) the total distance travel by the particle for the whole journey.
(b)   the average speed for the whole journey.
 
Solution:
(a)
Total distance travelled
= Area under the speed-time graph
= Area of triangle
= ½ × 15 × 10
= 75 m

(b)
Average speed for the whole journey
= Total distance travelled Total time taken = 75 10 = 7.5 m s 1

6.3 SPM Practice (Long Questions)


Question 5:


The diagram above shows the speed-time graph of a moving particle for 12 seconds. Find
(a) the length of the time, in s that the particle move with uniform speed.
(b)   the distance travel by the particle when it move with constant speed.
(c)  the distance travel by the particle when the rate of the speed change is negative.

Solution:

(a)
Length of the time the particle move with uniform speed
= 10 – 6
= 4 s

(b)

Distance travel by the particle when it move with constant speed
= Area under the speed-time graph
= Area of rectangle
= 4 × 10
= 40 m

(c)
Distance travel by the particle when the rate of the speed change is negative
= Area under the speed-time graph for the first 6 s
= Area of trapezium
= ½ (10 + 25)(6)
= 105 m


Question 6:
Diagram below shows the speed-time graph for the movement of an object for a period of 40 seconds.


(a) State the duration of time, in s, for which the object moves with uniform speed.
(b) Calculate the rate of change of speed, in ms-2, of the object for the last 12 seconds.
(c) Calculate the value of v, if the total distance travelled for the period of 40 seconds is 500 m.

Solution:
(a) Duration of time the object moves with uniform speed = 28s – 10s = 18s

(b) Rate of change of speed = 15 12 ms 2 =1.25  ms 2 (c) Area of trapezium I + Area of trapezium II=500 1 2 ( v+15 )10+ 1 2 ( 18+30 )15=500    5v+75+360=500 5v=65   v=13

6.1 Quantity Represented by the Gradient of a Graph (Part 1)


6.1 Quantity Represented by the Gradient of a Graph
The gradient of graph is the rate of change of a quantity on the vertical axis with respect to the change of another quantity on the horizontal axis.
 
(A) Distance – Time Graph
1. The gradient of a distance-time graph is speed.


2. 


(a) From O to P: Gradient = positive
(b) From P to Q: Gradient = 0 → (The object stopped moving)
(c) From Q to R: Gradient = negative → (The object is travelling in an opposite direction from the original direction).


3.


Example 1:


The diagram above shows a graph of distance-time for the motion of a car. Find the speed of the car for the first 6 second.

Solution:
The speed of the car for the first 6 seconds
= Gradient 
= 12 0 6 0 = 2.0 ms 1

5.1 Direct Variation (Sample Questions)


Example:
Given that p varies directly as square root of q and p = 12 when = 36, find
(a) The value of p when = 16
(b) The value of q when = 18

Solution:

p q , p = k q 12 = k 36
12 = k(6)
k = 2
p = 2 q

(a)
p = 2 q p = 2 16
p = 8

(b)   
p = 2 q 18 = 2 q 9 = q  
9² = q
q = 81

5.4 SPM Practice (Short Questions)


Question 5:
It is given that R varies directly as the square root of S and inversely as the square of T. Find the relation between R, S and T.

Solution:
R α S T 2


Question 6:
It is given that P varies directly as the square of Q and inversely as the square root of R. Given that the constant is k, find the relation between P, Q and R.

Solution:

P α Q 2 R P = k Q 2 R


Question 7:
Given that P varies inversely as the cube root of Q. The relationship between P and Q is

Solution:
P α 1 Q 3 P α 1 Q 1 3


Question 8:
Given that y varies inversely as the cube of x and y = 16 when x = ½. Express y in terms of x.

Solution:
y α  1 x 3 y= k x 3 When y=16, x= 1 2 16= k ( 1 2 ) 3 16= k 1 8 k=2 y= 2 x 3


Question 9:
W varies directly with X and inversely with the square root of Y. Given that k is a constant, find the relation between W, X and Y.

Solution:
W α X Y W = k X Y W = k X Y 1 2