5.3.3 Sketching Graphs of Trigonometric Functions
Example 1:
Sketch the graph of each of the following trigonometric functions for π ≤ x ≤ 2π.
(g) y = –sin x
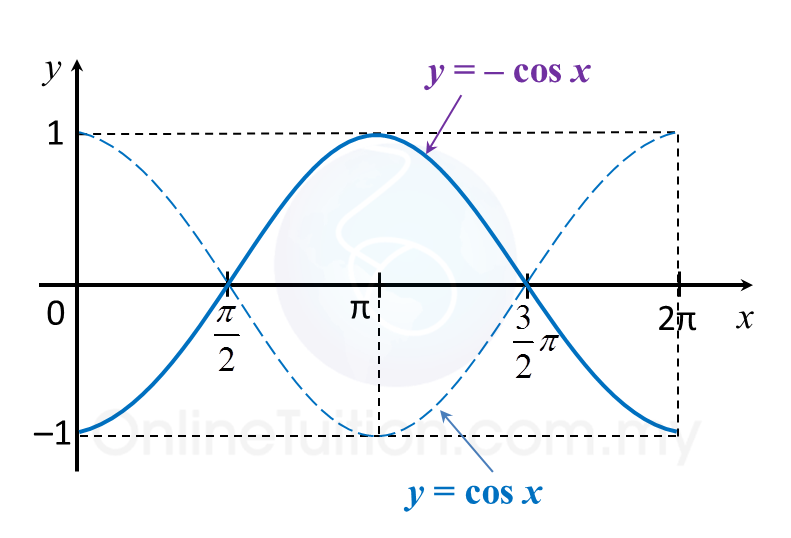
(h) y = –cos x
(h) y = –cos x
(i) y = | sin x |
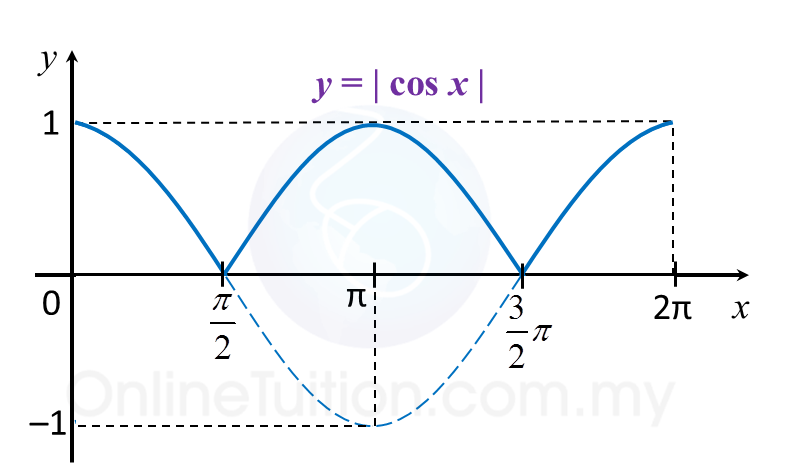
(j) y = | cos x |
(j) y = | cos x |
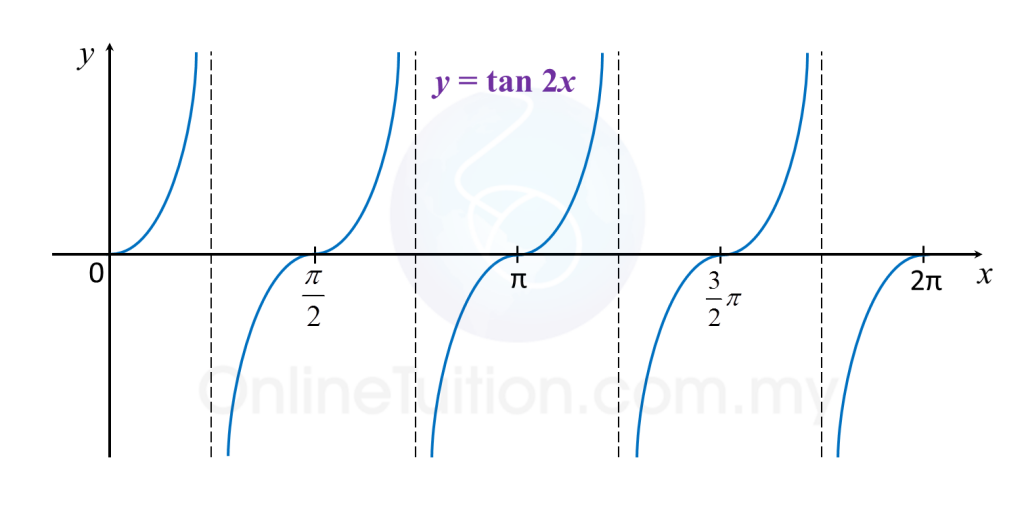
(k) y = tan 2x
Solution:
(g)
(h)
(i)
(j)
(k)
8.2b Standard Normal Distribution Tables (Example 2)
Example 2:
Find the value of each of the following probabilities by reading the standard normal distribution tables.
(a) P (0.4 < Z < 1.2)
(b) P (–1 < Z < 2.5)
(c) P (–1.3 < Z < –0.5)
Solution:
(a)
P (0.4 < Z < 1.2)
= Area P – Area Q
= Q (0.4) – Q (1.2) ← (reading from the standard normal distribution table for 0.4 and 1.2 are 0.3446 and 0.1151 respectively)
= 0.3446 – 0.1151
= 0.2295
(b)
P (–1 < Z < 2.5)
= 1– Area P – Area Q
= 1 – Q (1) – Q (2.5)
= 1 – 0.1587 – 0.00621 ← (reading from the standard normal distribution table for 1 and 2.5 are 0.1587 and 0.00621 respectively)
= 0.8351
(c)
P (–1.3 < Z < –0.5)
= Area P – Area Q
= Q (0.5) – Q (1.3)
= 0.3085 – 0.0968 ← (reading from the standard normal distribution table for 0.5 and 1.3 are 0.3085 and 0.0968 respectively)
8.2c Probability of an Event
Example:
The masses of pears in a fruit stall are normally distributed with a mean of 220 g and a variance of 100 g. Find the probability that a pear that is picked at random has a mass
(a) of more than 230 g.
(b) between 210 g and 225 g.
Hence, find the value of h such that 90% of the pears weigh more than h g.
Solution:
µ = 220 g
σ = √100 = 10 g
Let X be the mass of a pear.
(a)
(b)
For 90% (probability = 0.9) of the pears weigh more than h g,
P (X > h) = 0.9
P (X < h) = 1 – 0.9
= 0.1
From the standard normal distribution table,
P (Z > 0.4602) = 0.1
P (Z < –0.4602) = 0.1
8.2b Standard Normal Distribution Tables (Example 3)
Example 3:
Find the value of k if
(a) P (Z > k) = 0.0480
(b) P (Z > k) = 0.8350
Solution:
(a)
From the standard normal distribution table, k = 1.665
Z |
6 |
5 (Subtract) |
1.6 |
.0485 |
5 |
(b)
From the standard normal distribution table,
k = –0.974 ← (Remember to put a negative sign at the value of k because it is on the left-hand side of the normal curve.)
Z |
7 |
4 (Subtract) |
0.9 |
.1660 |
10 |
8.2b Standard Normal Distribution Tables (Example 1)
Example 1:
Find the value of each of the following probabilities by reading the standard normal distribution tables.
(a) P (Z > 0.600)
(b) P (Z < –1.24)(c) P (Z > –1.1)
(d) P (Z < 0.76)
Solution:
Standard Normal Distribution Table
*When reading the standard normal distribution tables, it involves subtraction of values.
(a)
From the standard normal distribution table, P (Z > 0.600) = 0.2743
P (Z < –1.24)
= P (Z > 1.24)
= Q (1.24)
= 0.1075 ← (reading from the standard normal distribution table)
(*In the standard normal distribution table, all the values of z are positive. As the curve is symmetrical about the vertical axis, the area of the shaded region in both of the graphs are the same.)
(c)
(d)
(c)
P (Z > –1.1)
= 1 – Area P
= 1 – Q (–1.1)
= 1 – 0.1357 ← (reading from the standard normal distribution table)
= 0.8643
(d)
P (Z < 0.76)
= 1 – Area P
= 1 – Q (0.76)
= 1 – 0.2236 ← (reading from the standard normal distribution table)
= 0.7764
4.3.1a Addition of Vectors (Examples)
Example 1:
(a) The resultant vector of the addition of the two parallel vectors above
(b) The magnitude of the resultant vector.
Solution:
(a)
Resultant vector
= addition of the two vectors
(b)
Magnitude of the resultant vector
3.6.1 Integration as the Summation of Volumes – Examples
Example 1:
Solution:
Volume generated, Vx
Example 2:
Solution:
Volume generated, Vy
Find the volume generated for the following diagram when the shaded region is revolved through 360° about the x-axis.
Solution:
Volume generated, Vx
Example 2:
Find the volume generated for the following diagram when the shaded region is revolved through 360° about the y-axis.
Volume generated, Vy
3.5.1 Integration as the Summation of Areas – Examples
Example 1
Find the area of the shaded region.
Solution:
Example 2
Find the area of the shaded region.
Solution:
Find the area of the shaded region.
Solution:
Example 2
Find the area of the shaded region.
Solution:
y = x -----(1)
x = 8y – y2-----(2)
Substitute (1) into (2),
y = 8y – y2
y2 – 7y = 0
y (y – 7) = 0
y = 0 or 7
From (1), x = 0 or 7
Therefore the intersection points of the curve and the straight line is (0, 0) and (7, 7).
Intersection point of the curve and y-axis is,
x = 8y – y2
At y-axis, x = 0
0 = 8y – y2
y (y – 8) = 0
y = 0, 8
Area of shaded region = (A1) Area of triangle + (A2) Area under the curve from y = 7 to y = 8.
3.4b Laws of Definite Integrals
Example:
Given that , find the values for each of the following:
Solution:
Example:
Given that , find the values for each of the following:
Solution:
Short Questions (Question 10)
Question 10 (4 marks):
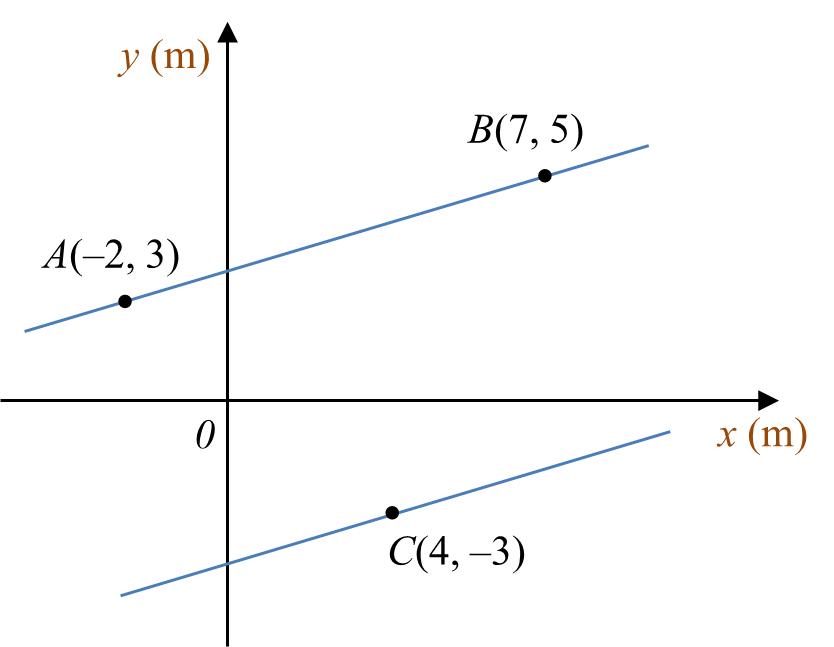
Diagram 10 shows the position of three campsites A, B and C at a part of a riverbank drawn on a Cartesian plane, such that A and B lie on the same straight riverbank.
Diagram 10
Sam wants to cross the river from campsite C to the opposite riverbank where the campsites A and B are located.
Find the shortest distance, in m, that he can take to cross the river. Give your answer correct to four decimal places.
Solution: