10.3 SPM Practice (Long Questions)


Question 7 (12 marks):
You are not allowed to use graph paper to answer this question.

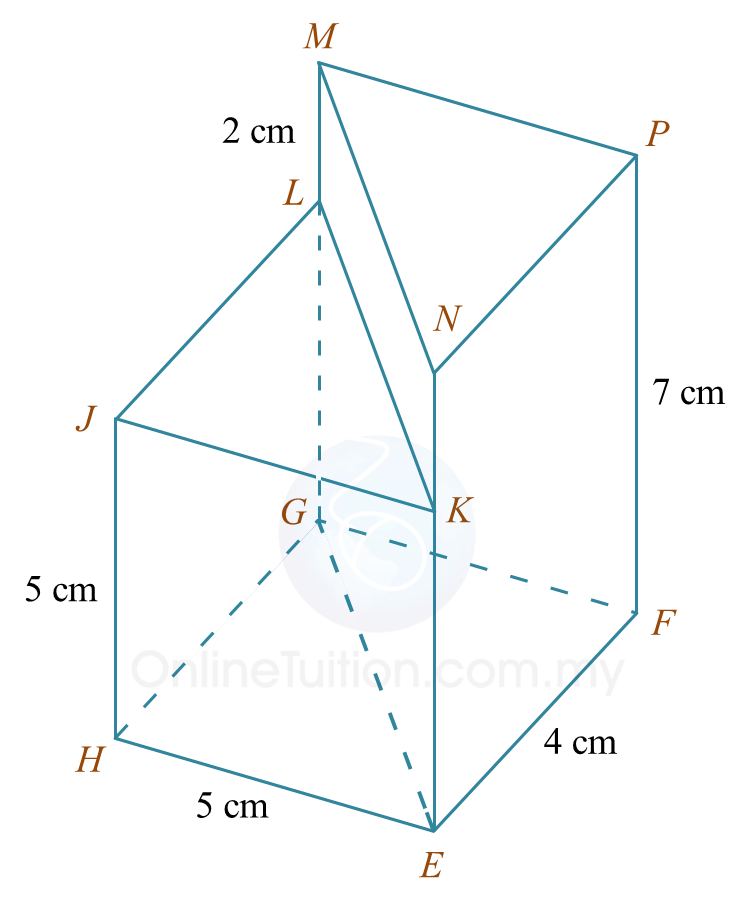
(a) Diagram 7.1 shows a solid prism with a rectangular base JKLM on a horizontal plane. The surface MQRSTL is the uniform cross section of the prism. Triangle STU and PQR are horizontal planes. Edges PJ, RS and UK are vertical. PQ = TU = 3 cm.
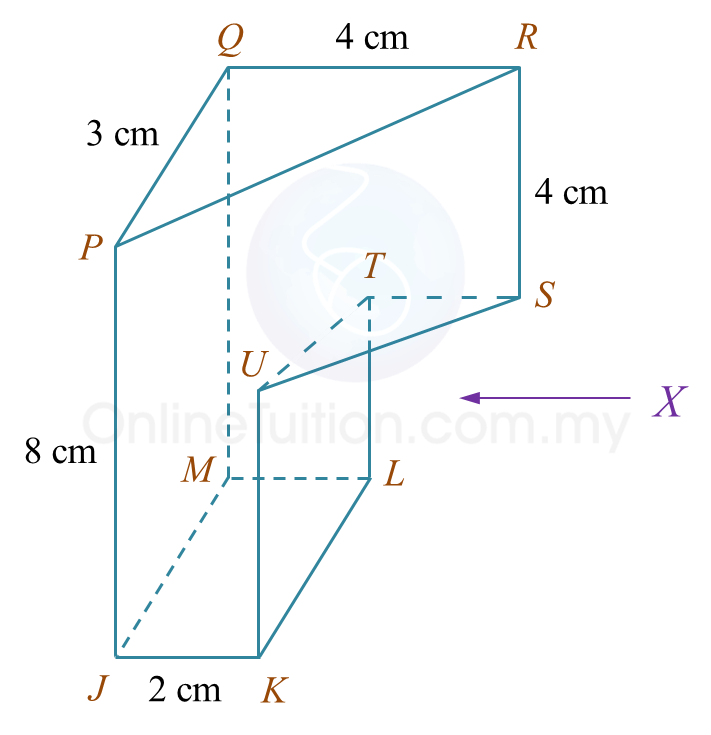
Diagram 7.1

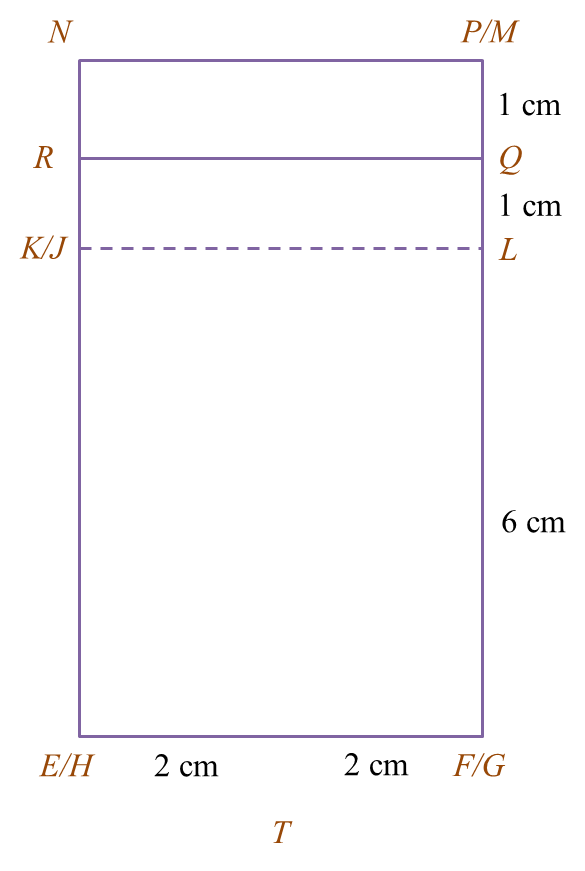
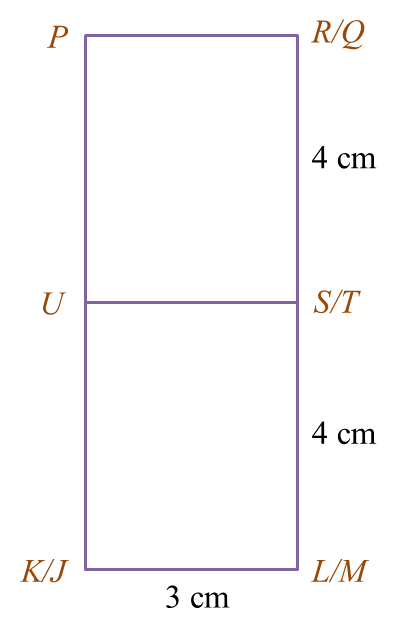
Draw to full scale, the elevation of the solid on a vertical plane parallel to KL as viewed from X.


(b)
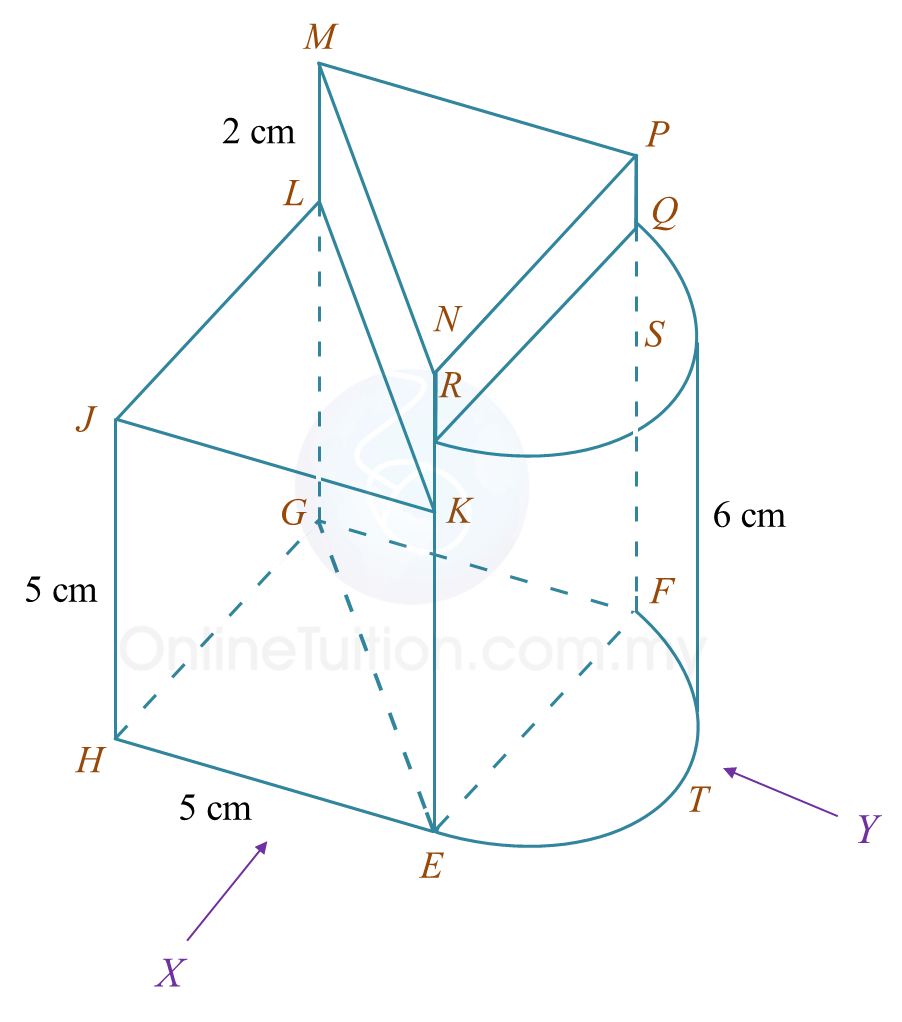
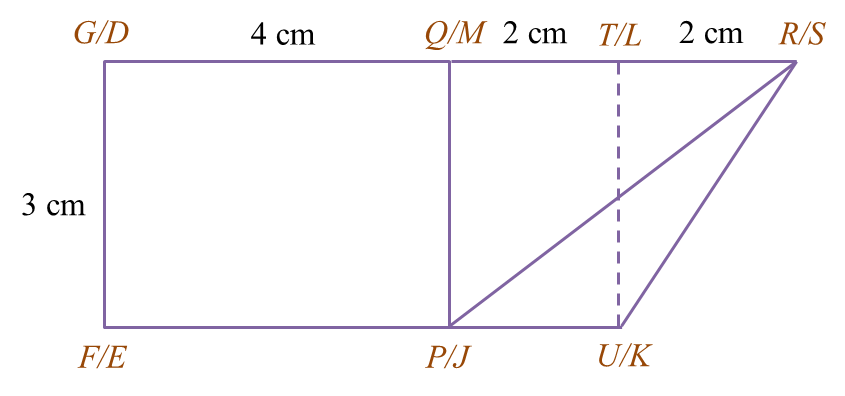
 Another solid cuboid with rectangle base JMDE is combined to the prism in Diagram 7.1 at the vertical plane JMQP. The composite solid is as shown in Diagram 7.2. The base EJKLMD lies on a horizontal plane.
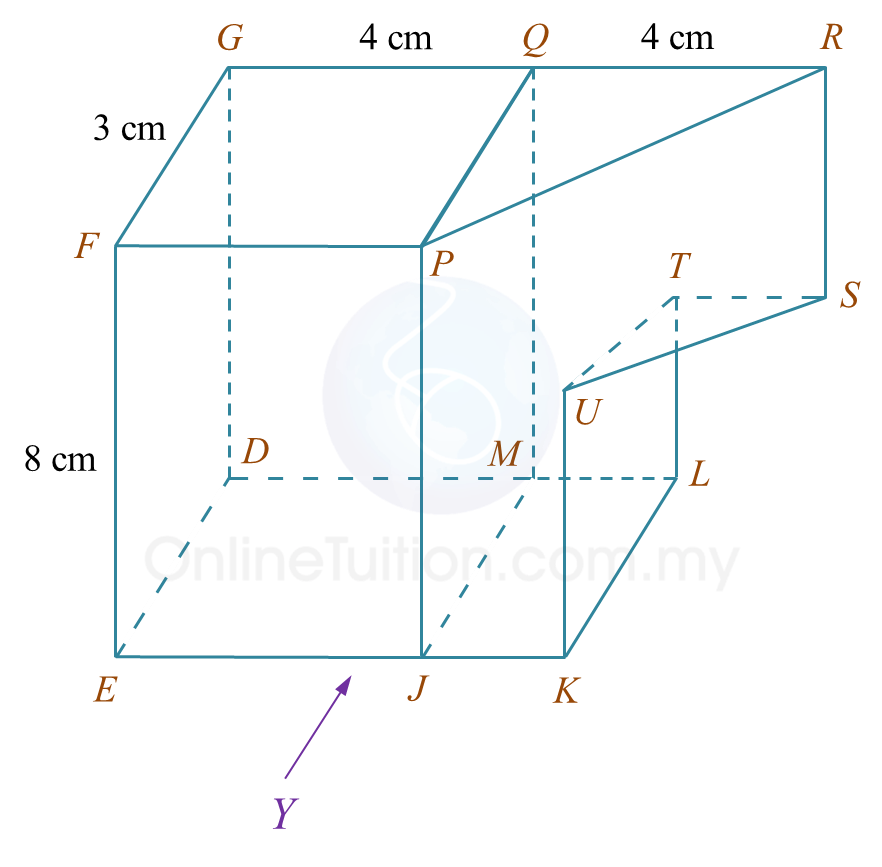
Diagram 7.2

Draw to full scale,
(i) the elevation of the composite solid on a vertical plane parallel to EJK as viewed from Y.
(ii) the plan of the composite solid.


Solution:
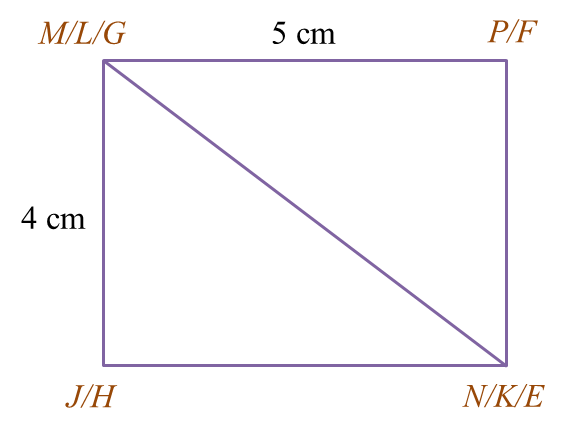
(a)


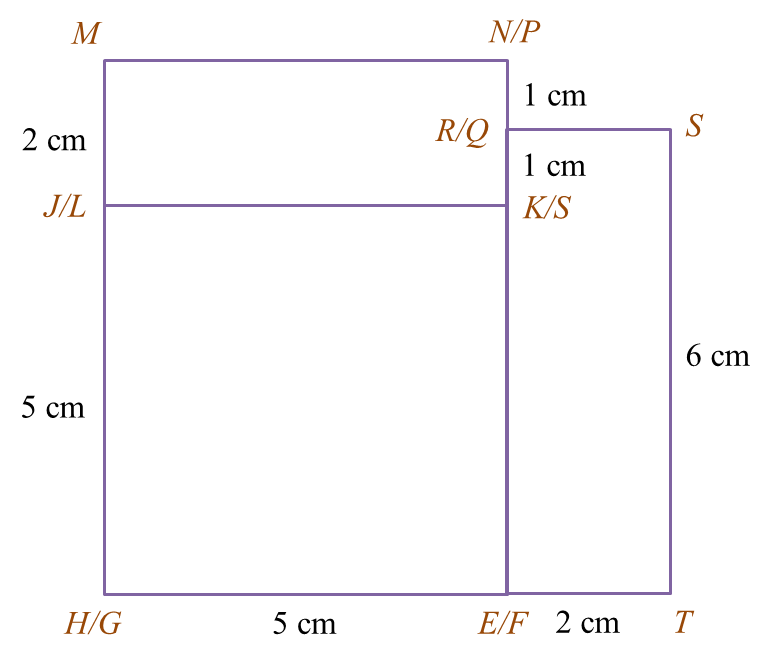
(b)(i)
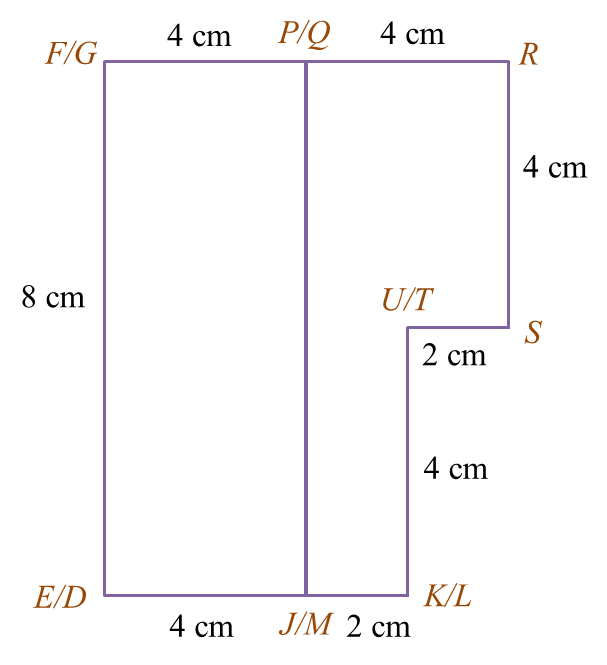


(b)(ii)


10.3 SPM Practice (Long Questions)


Question 6 (12 marks):
You are not allowed to use graph paper to answer this question.

(a) Diagram 6.1 shows two solid right prisms joined at the vertical plane EGLK. The planes JKL and MNP are the uniform cross sections of the prism HEGLJK and prism EFGMNP respectively. The base EFGH is a rectangle which lies on a horizontal plane. Edges HJ and EK are vertical.

Diagram 6.1

Draw, to full scale, the plan of the composite solid.


(b)
Another solid half cylinder with a diameter of 4 cm is joined to the prism in Diagram 9.1 at the vertical plane EFQR. The composite solid is as shown in Diagram 6.2. The base HETFG lies on a horizontal plane.

Diagram 6.2

Draw to full scale,
(i) the elevation of the composite solid on a vertical plane parallel to HE as viewed from X.
(ii) the elevation of the composite solid on a vertical plane parallel to EF as viewed from Y.


Solution:
(a)


(b)(i)


(b)(ii)


10.3 SPM Practice (Long Questions)


Question 5 (12 marks):
You are not allowed to use graph paper to answer this question.

(a)
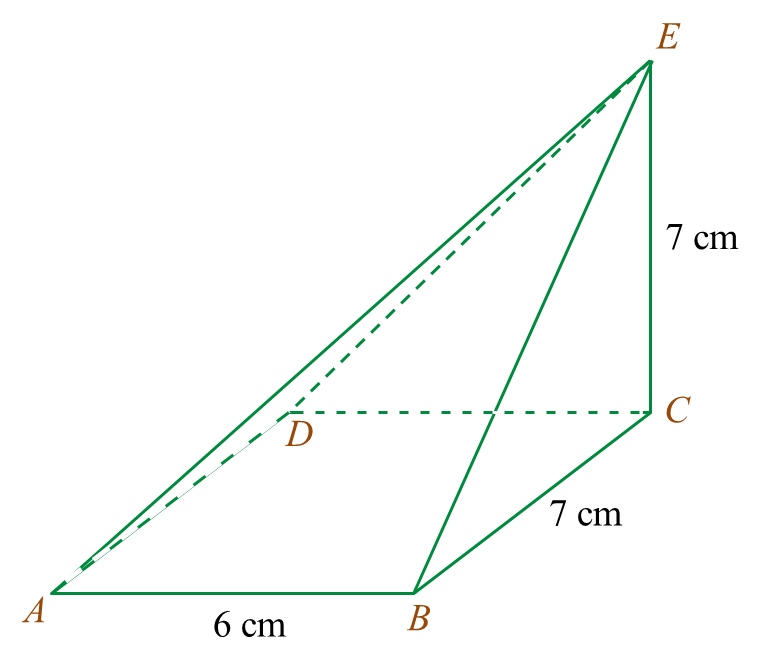
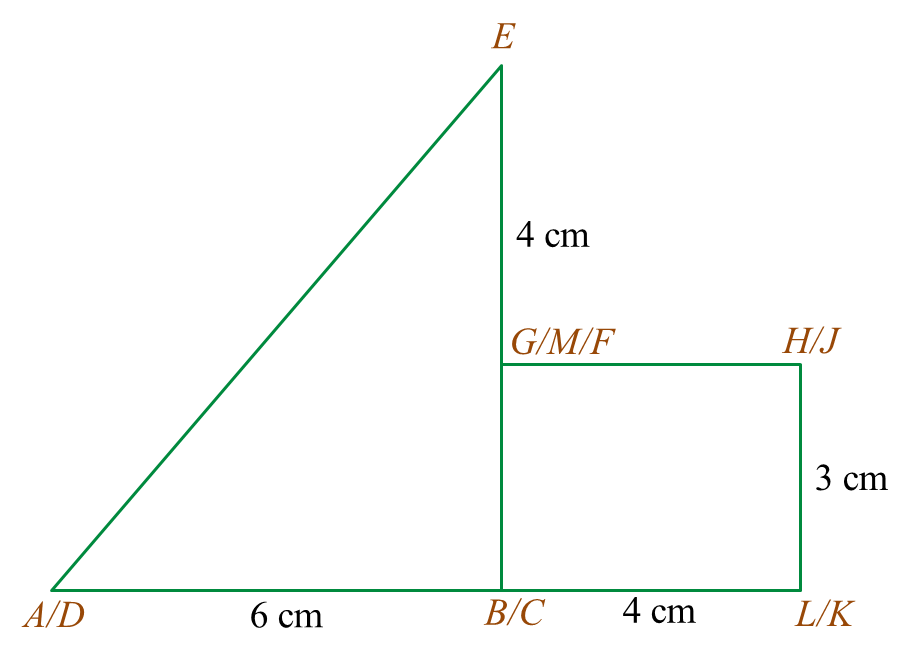
Diagram 5.1 shows a pyramid with rectangular base ABCD on a horizontal plane. Vertex E is vertically above C. Triangles BCE and DCE are vertical planes. Triangles ABE and ADE are inclined planes.

Diagram 5.1

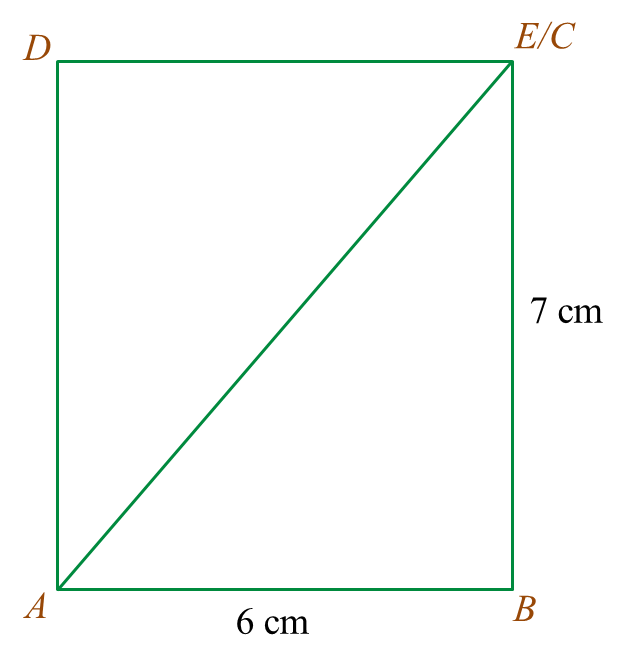
Draw to full scale, the plan of the solid.


(b)
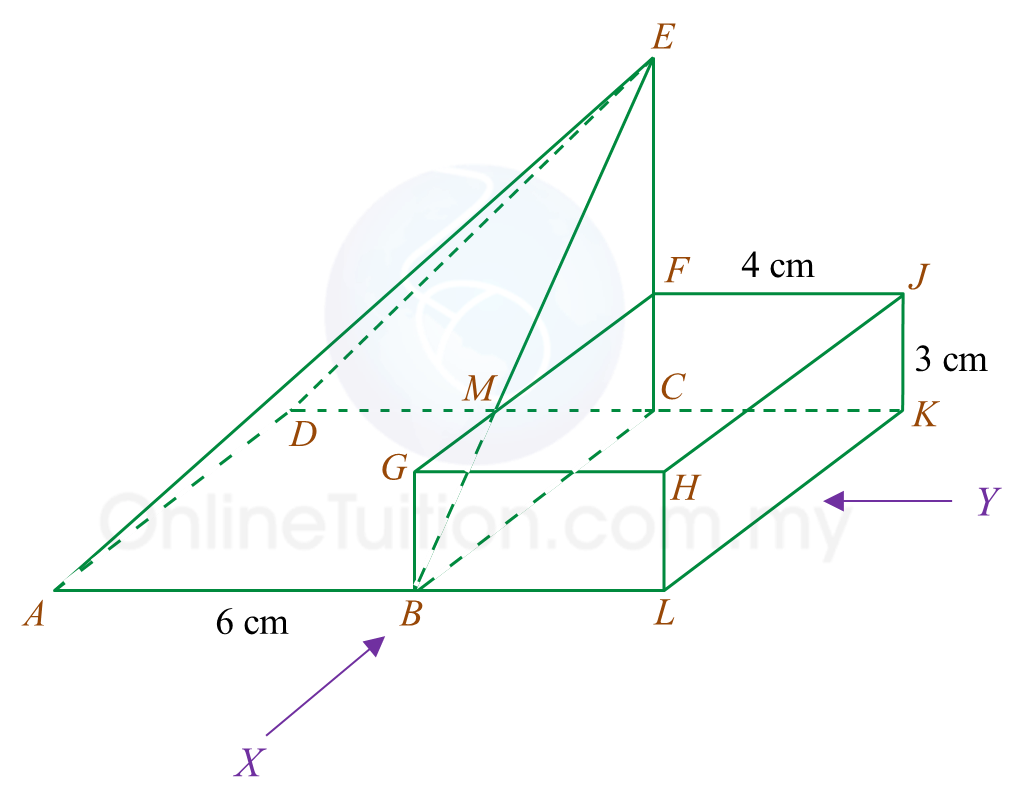
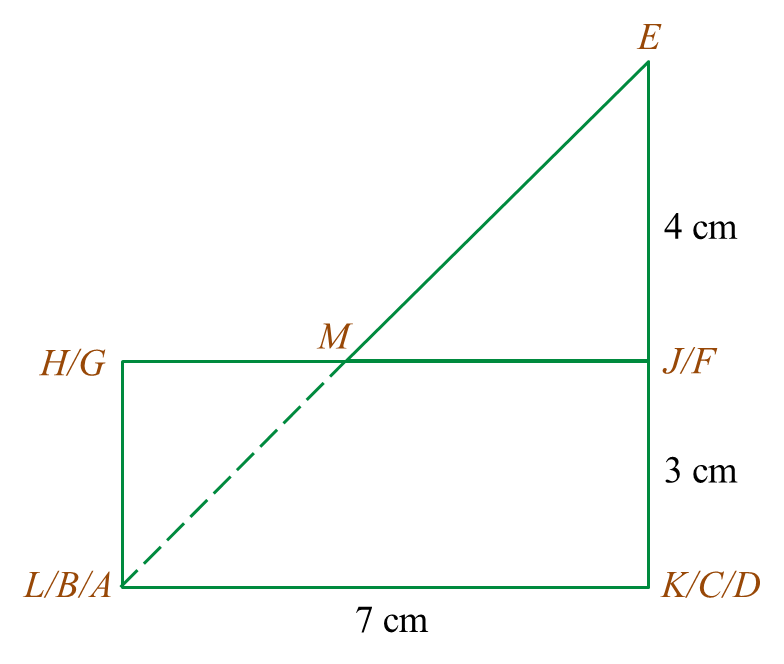
Another solid cuboid with rectangle base BLKC is joined to the pyramid in Diagram 5.1 at the vertical plane BCFM. The composite solid is as shown in Diagram 5.2. The base ABLKCD lies on a horizontal plane

Diagram 5.2

Draw to full scale,
(i) the elevation of the composite solid on a vertical plane parallel to ABL as viewed from X.

(ii)
the elevation of the composite solid on a vertical plane parallel to LK as viewed from Y.


Solution:

(a)


(b)(i)


(b)(ii)


6.7 SPM Practice (Long Questions)


Question 10 (12 marks):
Diagram shows a histogram which represents the mass, in kg, for a group of 100 students.

Diagram


(a)
Based on the Diagram, complete the Table in the answer space.

(b)
 Calculate the estimated mean mass of a student.

(c)
For this part of the question, use graph paper. You may use a flexible curve ruler.
Using a scale of 2 cm to 10 kg on the horizontal axis and 2 cm to 10 students on the vertical axis, draw an ogive for the data.

(d)
 Based on the ogive drawn in 10(c), state the third quartile.

Answer:


Solution:
(a)


(b)


Estimated mean mass = 8110 100 =81.1 kg


(c)


(d)
Third quartile
= 75th student
= 90.0 kg


6.7 SPM Practice (Long Questions)


Question 9 (12 marks):
The data in the Diagram shows the mass, in g, of 30 strawberries plucked by a tourist from a farm.

Diagram

(a)
Based on the Diagram, complete Table 3 in the answer space.

(b)
Based on Table, calculate the estimated mean mass of a strawberry.

(c)
For this part of the question, use graph paper.
By using the scale of 2 cm to 10 g on the horizontal axis and 2 cm to 1 strawberry on the vertical axis, draw a histogram for the data.

(d)
Based on the histogram drawn in 14(c), state the number of strawberries with the mass of more than 50 g.

Answer:


Solution:
(a)


(b)
Estimated mean mass = Total [ midpoint×frequency ] Total frequencies = 2( 14.5 )+5( 24.5 )+10( 34.5 )+8( 44.5 )+ 3( 54.5 )+2( 64.5 ) 2+5+10+8+3+2 = 1145 30 =38.17


(c)


(d)
Number of strawberries with the mass more than 50 g
= 3 + 2
= 5 


6.7 SPM Practice (Long Questions)


Question 8 (12 marks):
Diagram shows the marks obtained by a group of 36 students in a Mathematics test.

Diagram

(a)
Based on the data in Diagram, complete Table in the answer space.

(b)
Based on the Table, calculate the estimated mean mark of a student.

(c)
 For this part of the question, use graph paper.
By using the scale of 2 cm to 5 marks on the horizontal axis and 2 cm to 1 student on the vertical axis, draw a frequency polygon for the data.

(d)
Based on the frequency polygon in 8(c), state the number of students who obtained more than 40 marks.

Answer:
Table


Solution:
(a)

(b)
Estimated mean mark = Total [ Frequency×midpoint ] Total frequency = 2( 28 )+5( 33 )+7( 38 )+10( 43 )+             8( 48 )+4( 53 ) 2+5+7+10+8+4 = 1513 36 =42.03

(c)


(d)
Number of students who obtained more than 40 marks
= 10 + 8 + 4
= 22 students

SPM Practice Question 2


Question 2:
The third term and the sixth term of a geometric progression are 24 and 7 1 9 respectively. Find
(a) the first term and the common ratio,
(b) the sum of the first five terms,
(c) the sum of the first n terms with n is very big approaching rn ≈ 0.

Solution:
(a)
Given  T 3 =24  a r 2 =24 ...........( 1 ) Given  T 6 =7 1 9  a r 5 = 64 9  ...........( 2 ) ( 2 ) ( 1 ) : a r 5 a r 2 = 64 9 24    r 3 = 8 27    r= 2 3

Substitute r= 2 3  into ( 1 )    a ( 2 3 ) 2 =24 a( 4 9 )=24    a=24× 9 4  =54  the first term 54 and the common ratio is  2 3 .

(b)
S 5 = 54[ 1 ( 2 3 ) 5 ] 1 2 3    =54× 211 243 × 3 1    =140 2 3  sum of the first five term is 140 2 3 .

(c)
When 1<r<1 and n becomes  very big approaching  r n 0,   S n = a 1r    = 54  1   2 3      =162
Therefore, sum of the first n terms with n is very big approaching rn ≈ 0 is 162.

Short Questions (Question 7 & 8)


Question 7:
The masses of mangoes in a stall have a normal distribution with a mean of 200 g and a standard deviation of 30 g.
(a) Find the mass, in g, of a mango whose z-score is 0.5.
(b) If a mango is chosen at random, find the probability that the mango has a mass of at least 194 g.

Solution:
µ = 200 g
σ = 30 g
Let X be the mass of a mango.

(a)
X 200 30 = 0.5 X = 0.5 ( 30 ) + 200 X = 215 g

(b)
P ( X 194 ) = P ( Z 194 200 30 ) = P ( Z 0.2 ) = 1 P ( Z > 0.2 ) = 1 0.4207 = 0.5793


Question 8:
Diagram below shows a standard normal distribution graph.


The probability represented by the area of the shaded region is 0.3238.
(a) Find the value of k.
(b) X is a continuous random variable which is normally distributed with a mean of 80 and variance of 9.
Find the value of X when the z-score is k.

Solution:
(a)
P(Z > k) = 0.5 – 0.3238 
= 0.1762
k = 0.93

(b)
µ = 80,
σ2 = 9, σ = 3
X 80 3 = 0.93 X = 3 ( 0.93 ) + 80 X = 82.79

Short Questions (Question 5 & 6)


Question 5:
Diagram below shows the graph of a binomial distribution of X.

(a) the value of h,
(b) P (X ≥ 3)

Solution:
(a)
P (X = 0) + P (X = 1) + P (X = 2) + P (X = 3) + P (X = 4) = 1
1 16 + 1 4 + h + 1 4 + 1 16 = 1 h = 1 5 8 h = 3 8

(b)
P (X ≥ 3) = P (X = 3) + P (X = 4)
P ( X 3 ) = 1 4 + 1 16 = 5 16


Question 6:
The random variable X represents a binomial distribution with 10 trails and the probability of success is ¼.
(a) the standard deviation of the distribution,
(b) the probability that at least one trial is success.

Solution:
(a)
n = 10, p = ¼
Standard deviation = n p q = 10 × 1 4 × 3 4 = 1.875

(b)
P ( X = r ) = C 10 r ( 1 4 ) r ( 3 4 ) 10 r P ( X 1 ) = 1 P ( X < 1 ) = 1 P ( X = 0 ) = 1 C 10 0 ( 1 4 ) 0 ( 3 4 ) 10 = 0.9437

SPM Practice 2 (Question 11 & 12)


Question 11 (3 marks):
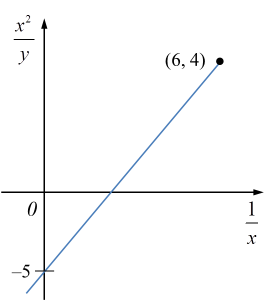
Diagram 6 shows the graph of a straight line x 2 y  against  1 x .  

Diagram 11

Based on Diagram 6, express y in terms of x.


Solution:

m= 4( 5 ) 60 = 3 2 c=5 Y= x 2 y X= 1 x Y=mX+c x 2 y = 3 2 ( 1 x )+( 5 ) x 2 y = 3 2x 5 x 2 y = 310x 2x y x 2 = 2x 310x y= 2 x 3 310x


Question 12 (3 marks):
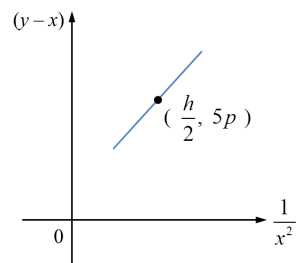
The variables x and y are related by the equation y=x+ r x 2 , where r is a constant. Diagram 8 shows a straight line graph obtained by plotting ( yx ) against  1 x 2 .

Diagram 12

Express h in terms of p and r.


Solution:

y=x+ r x 2 yx=r( 1 x 2 )+0 Y=mX+c m=r, c=0 m= y 2 y 1 x 2 x 1 r= 5p0 h 2 0 hr 2 =5p hr=10p h= 10p r