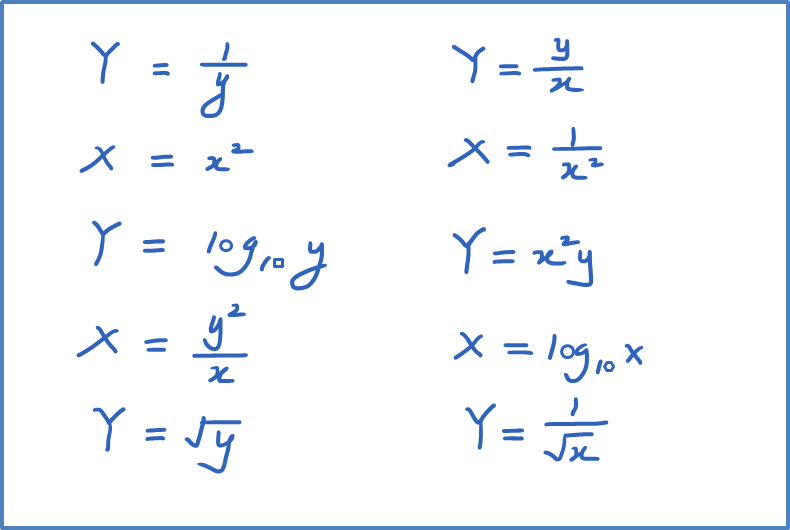
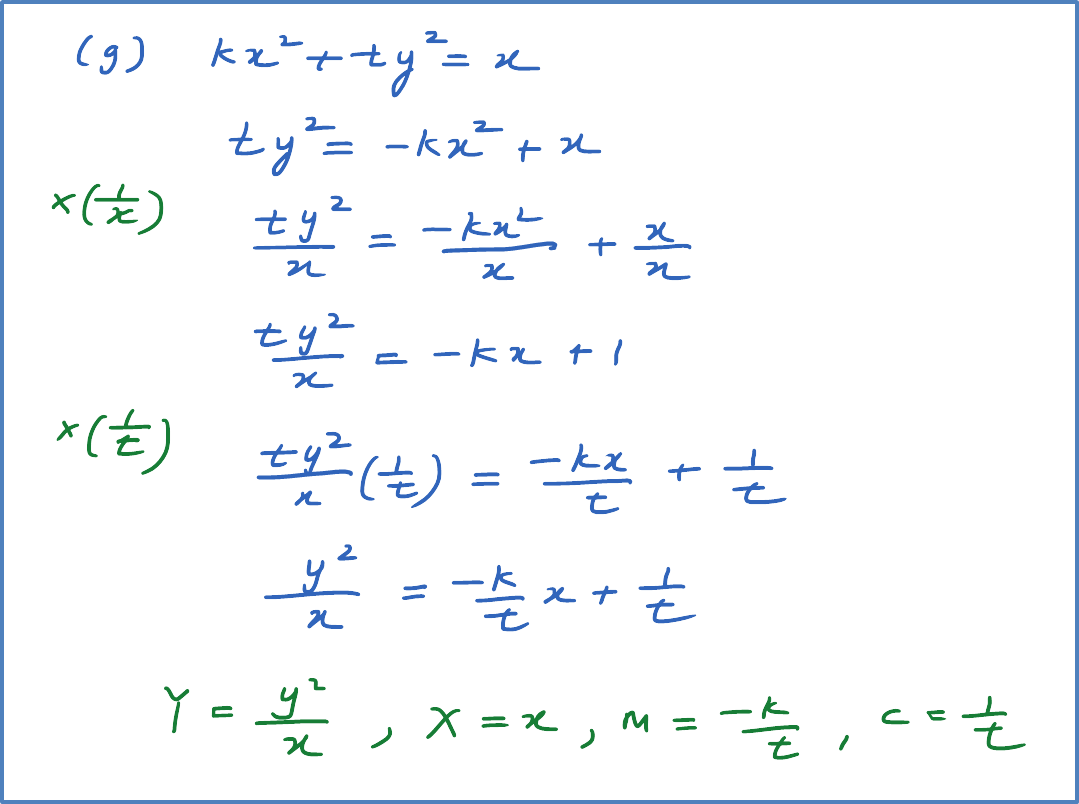
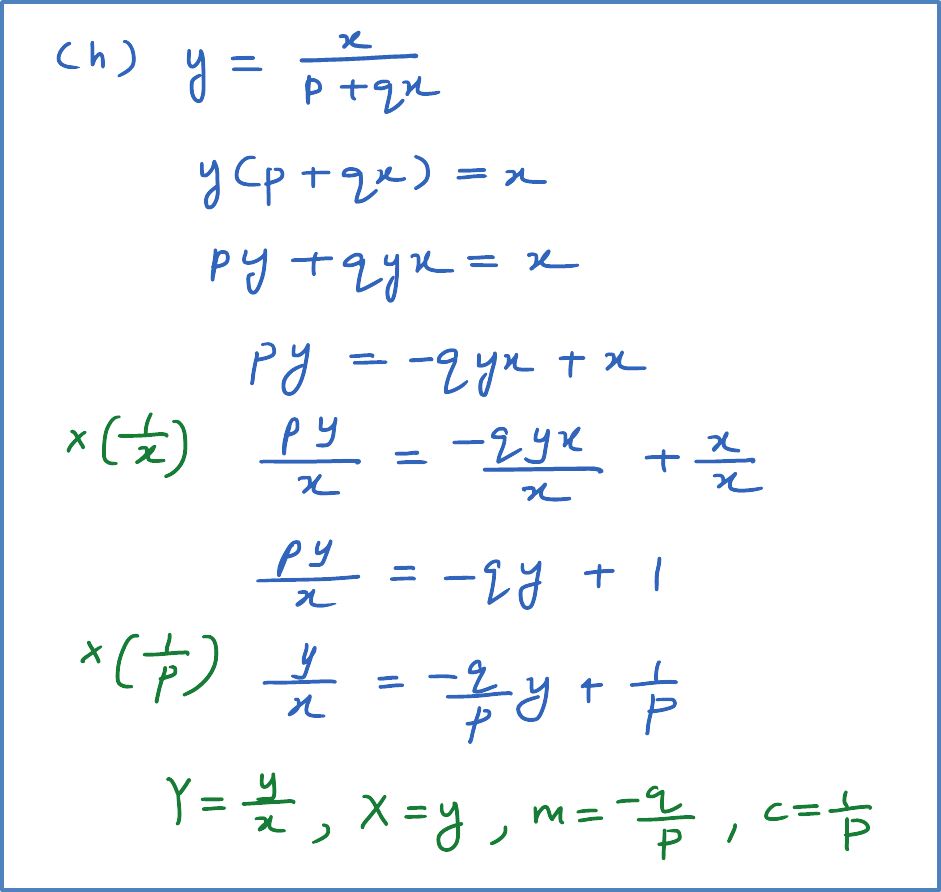
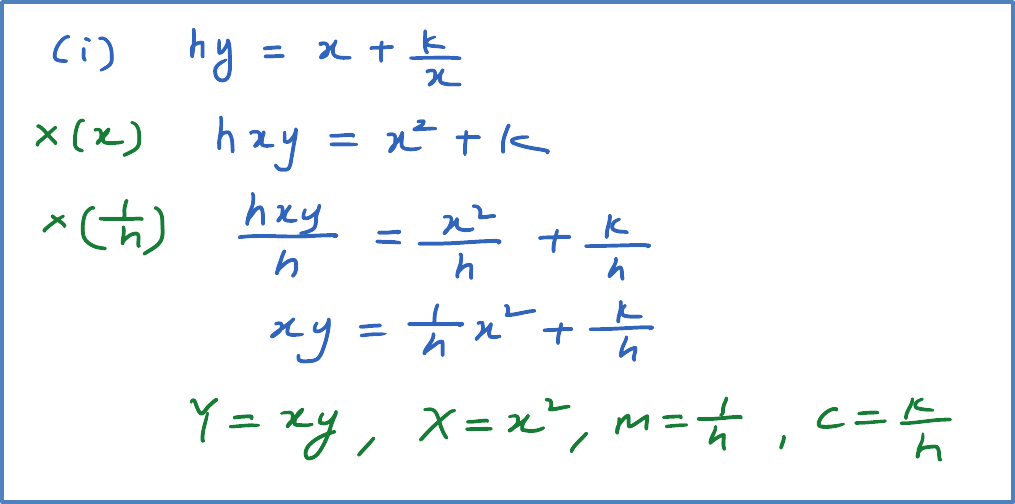
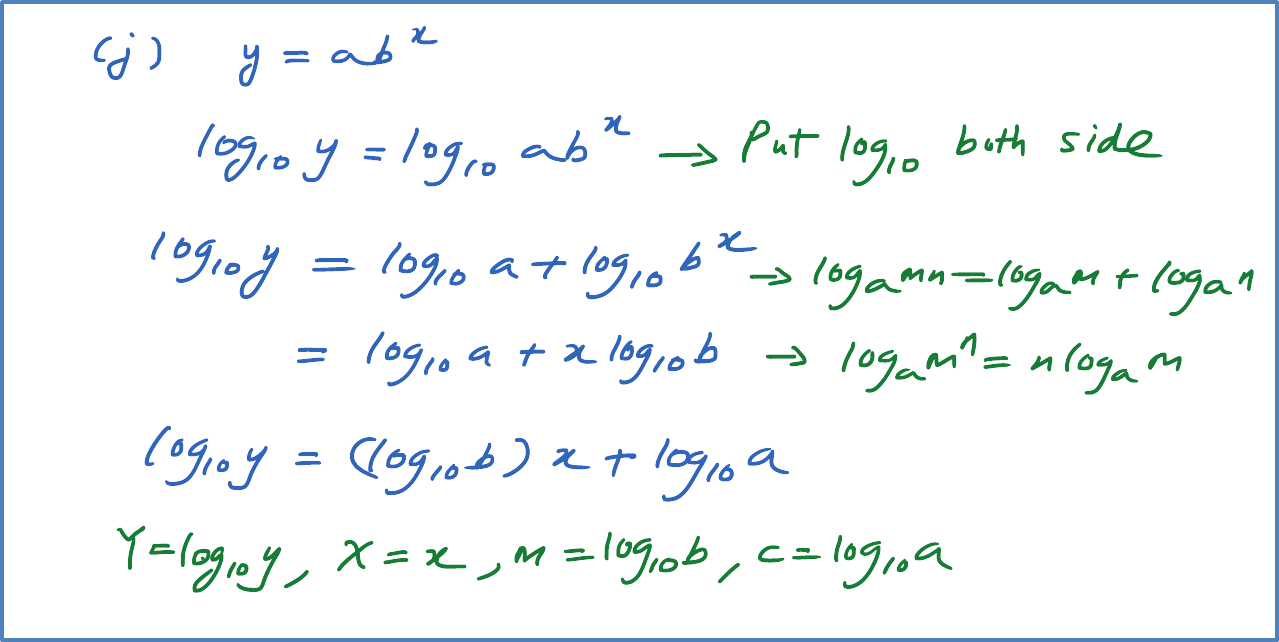
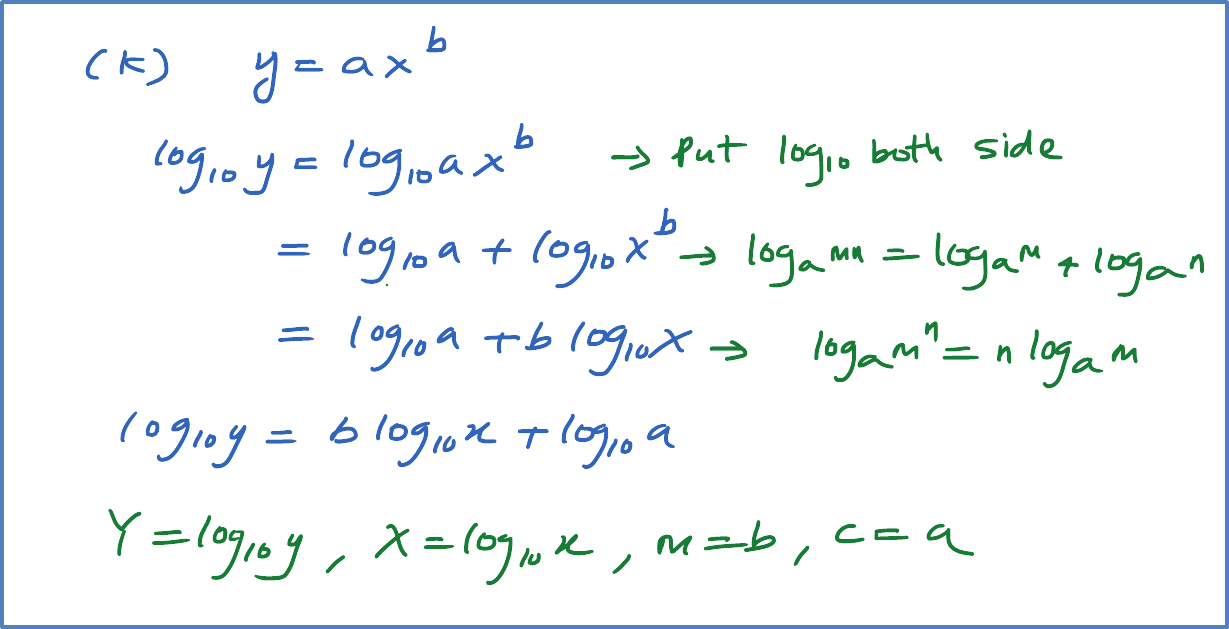
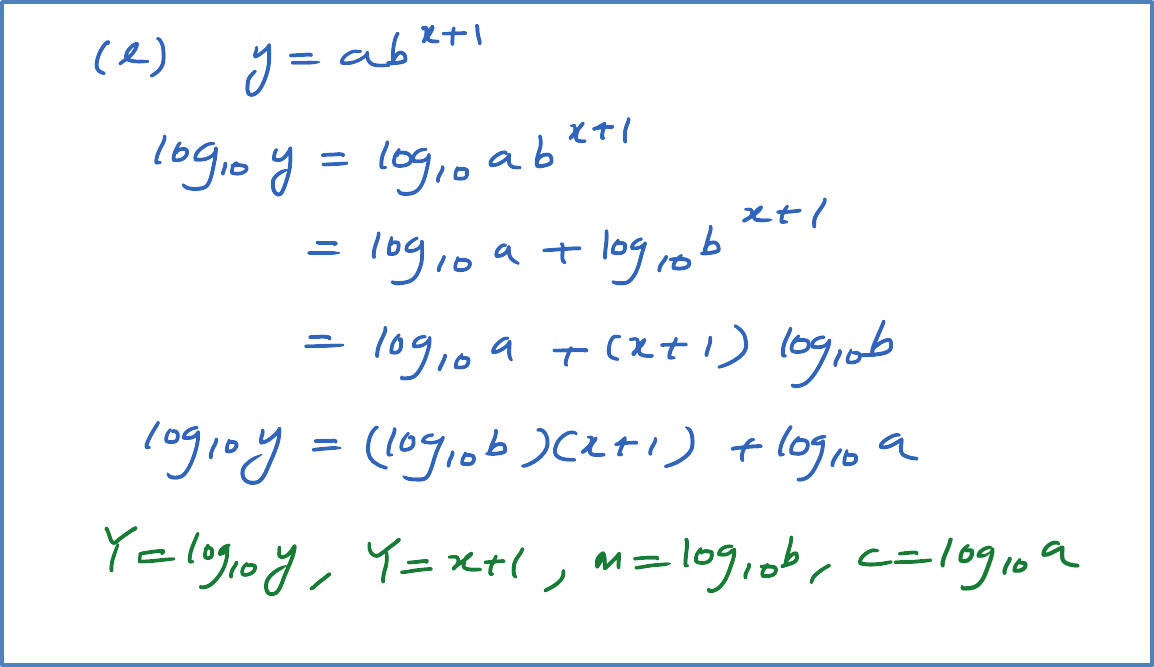
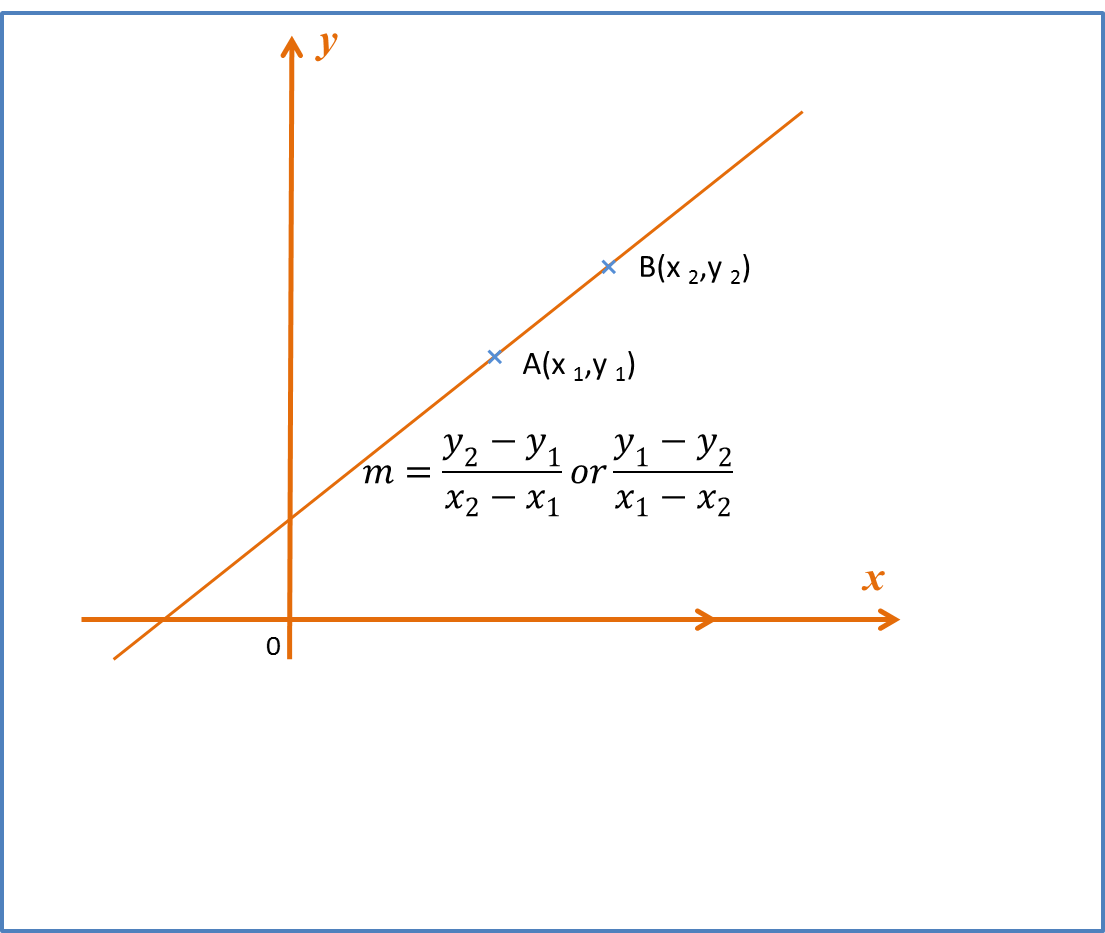
Question 1:
Reduce non-linear relation, , where k and n are constants, to linear equation. State the gradient and vertical intercept for the linear equation obtained.
[Note : Reduce No-linear function to linear function]
Solution: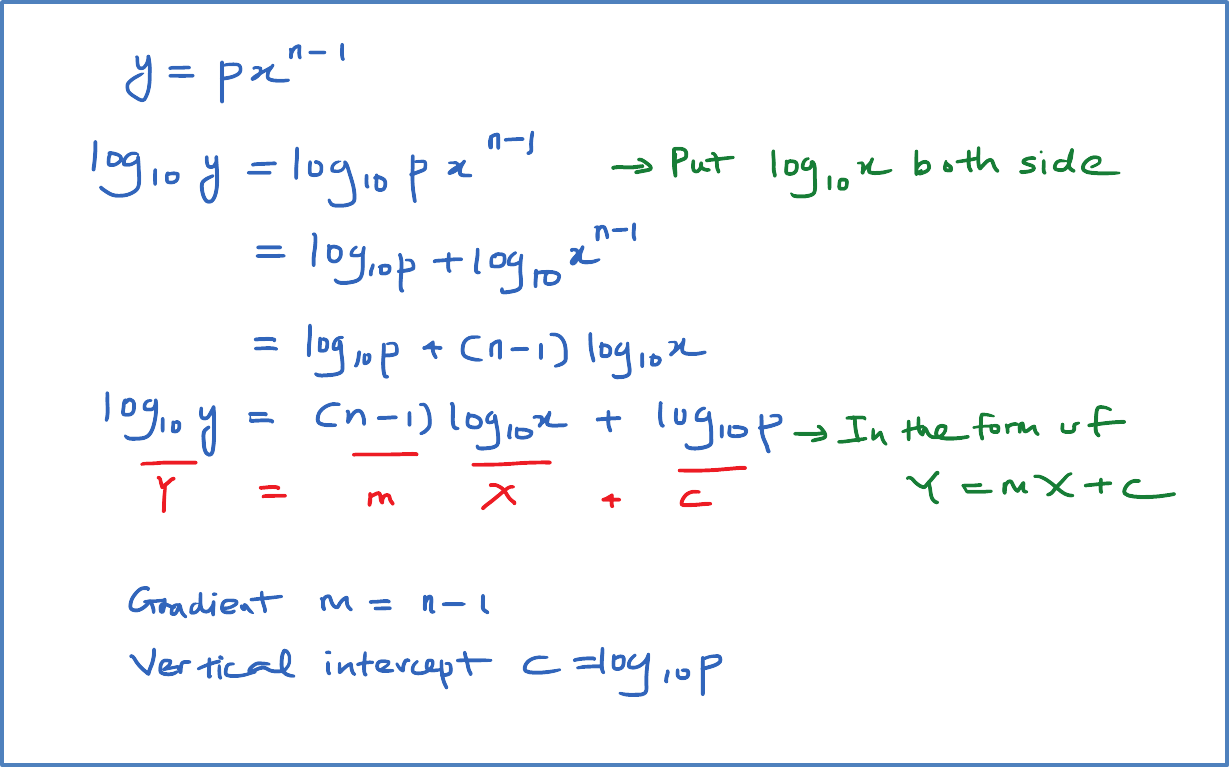
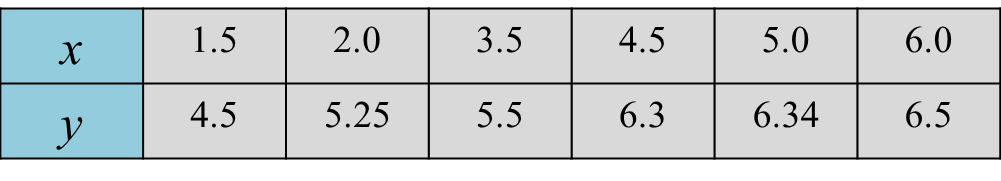
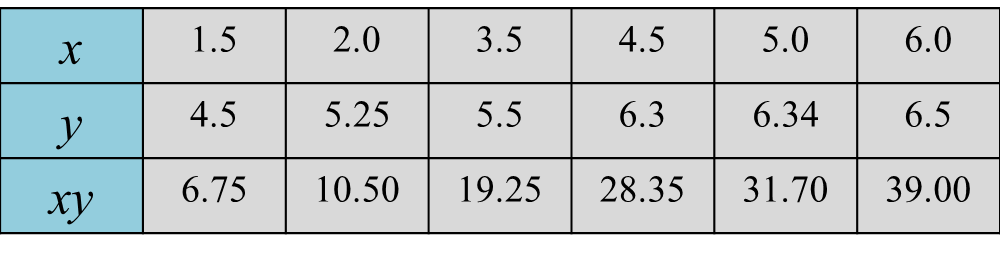
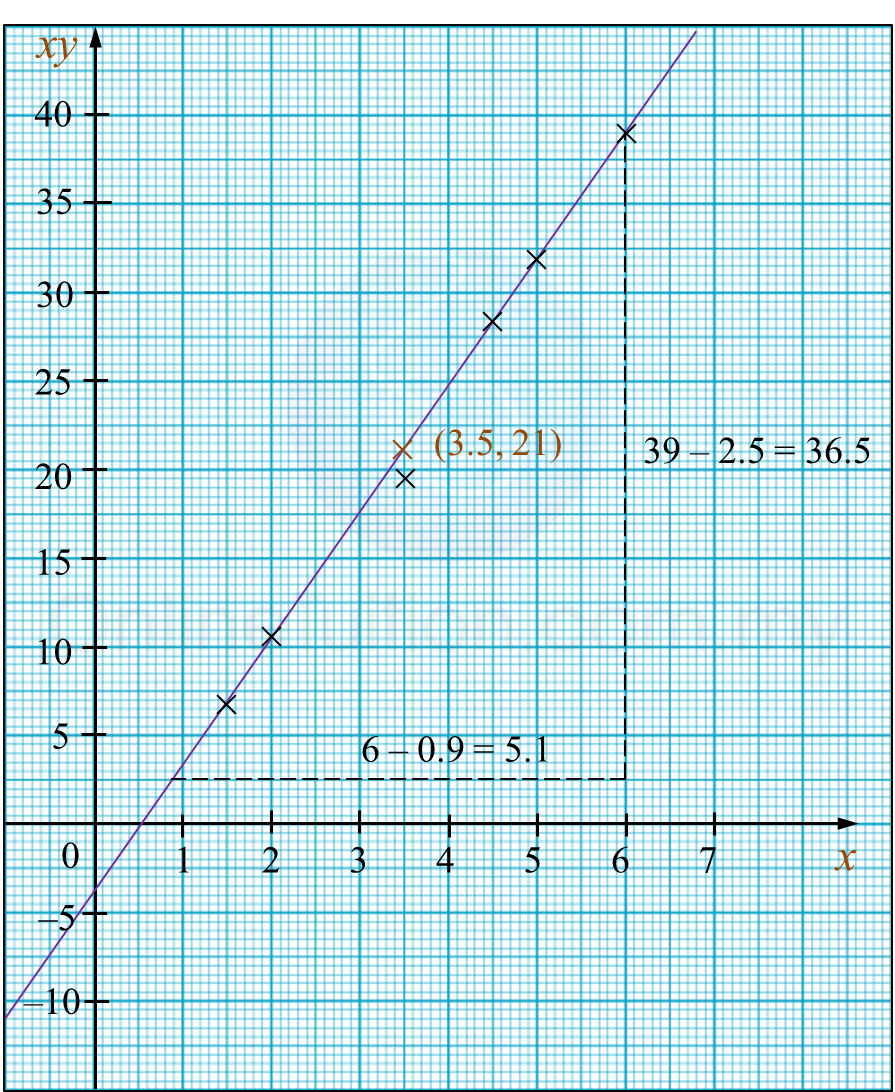
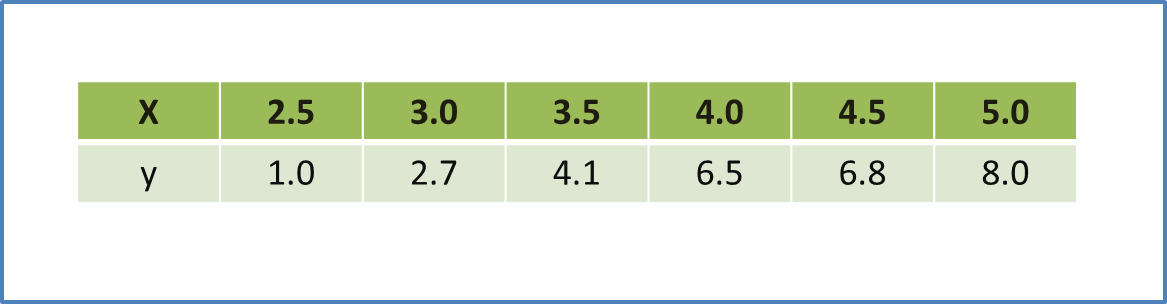
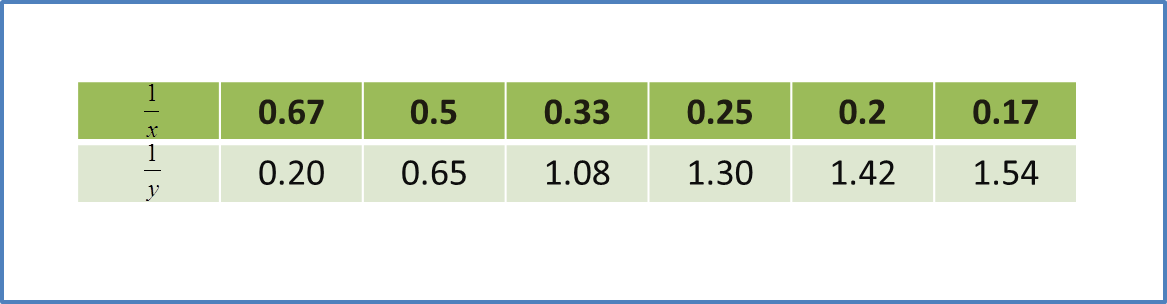
Question 2:
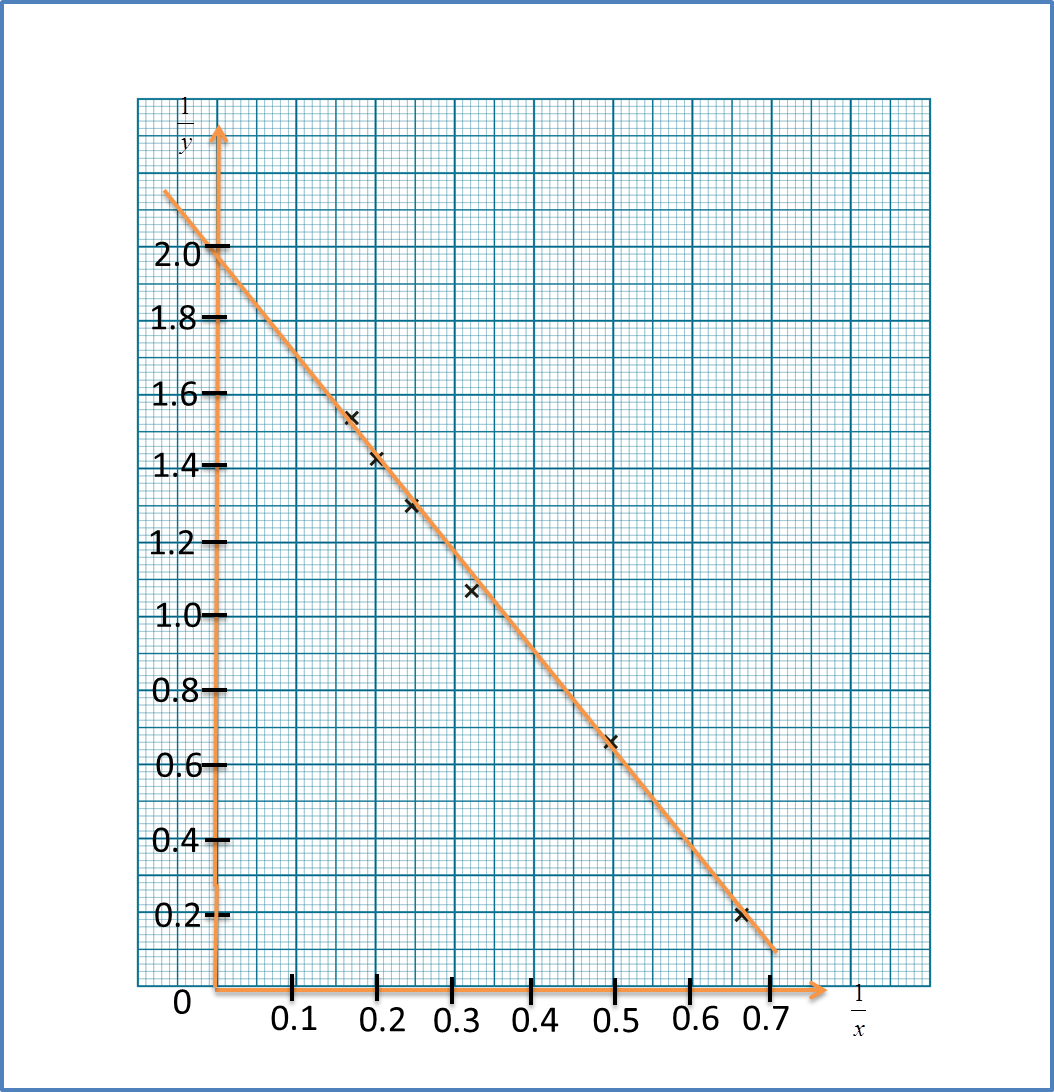
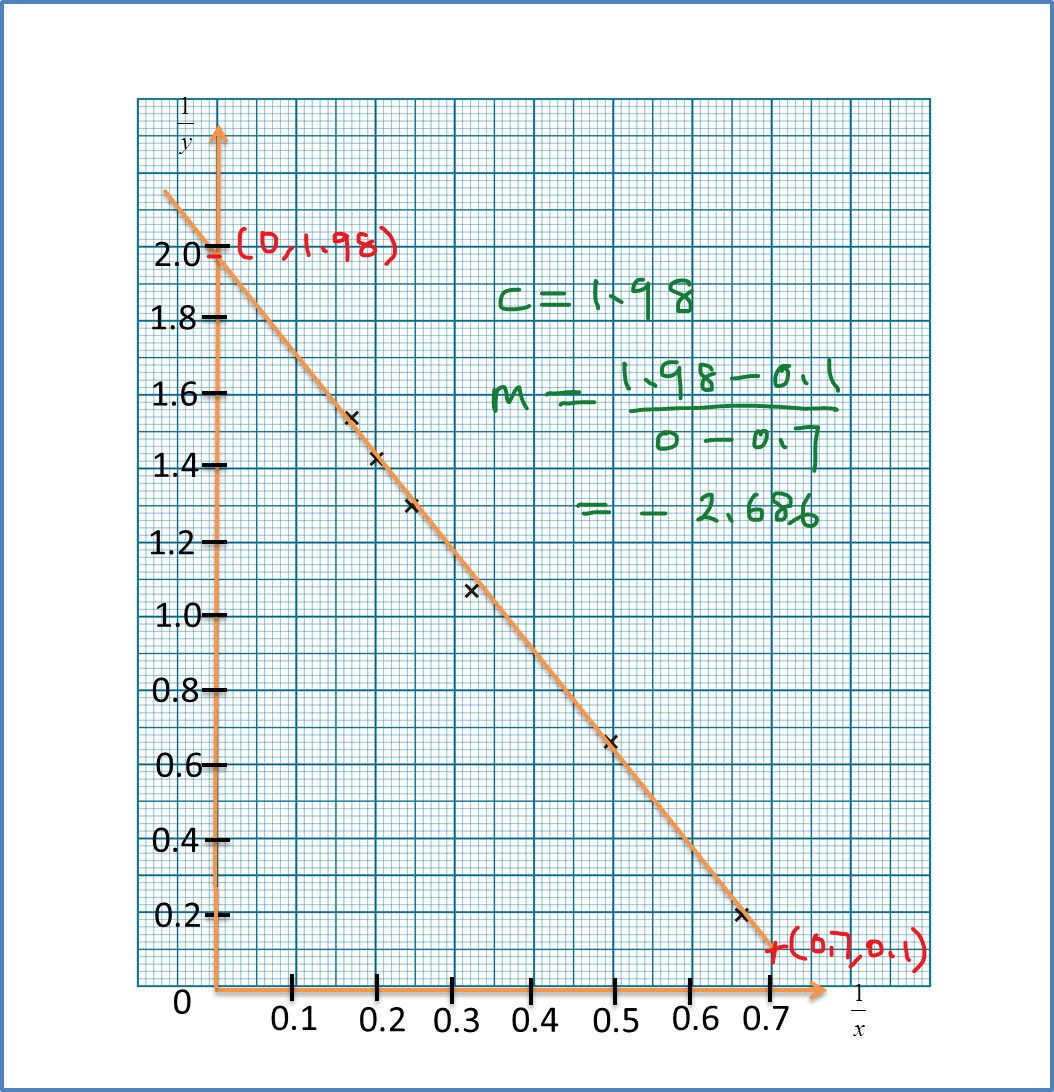
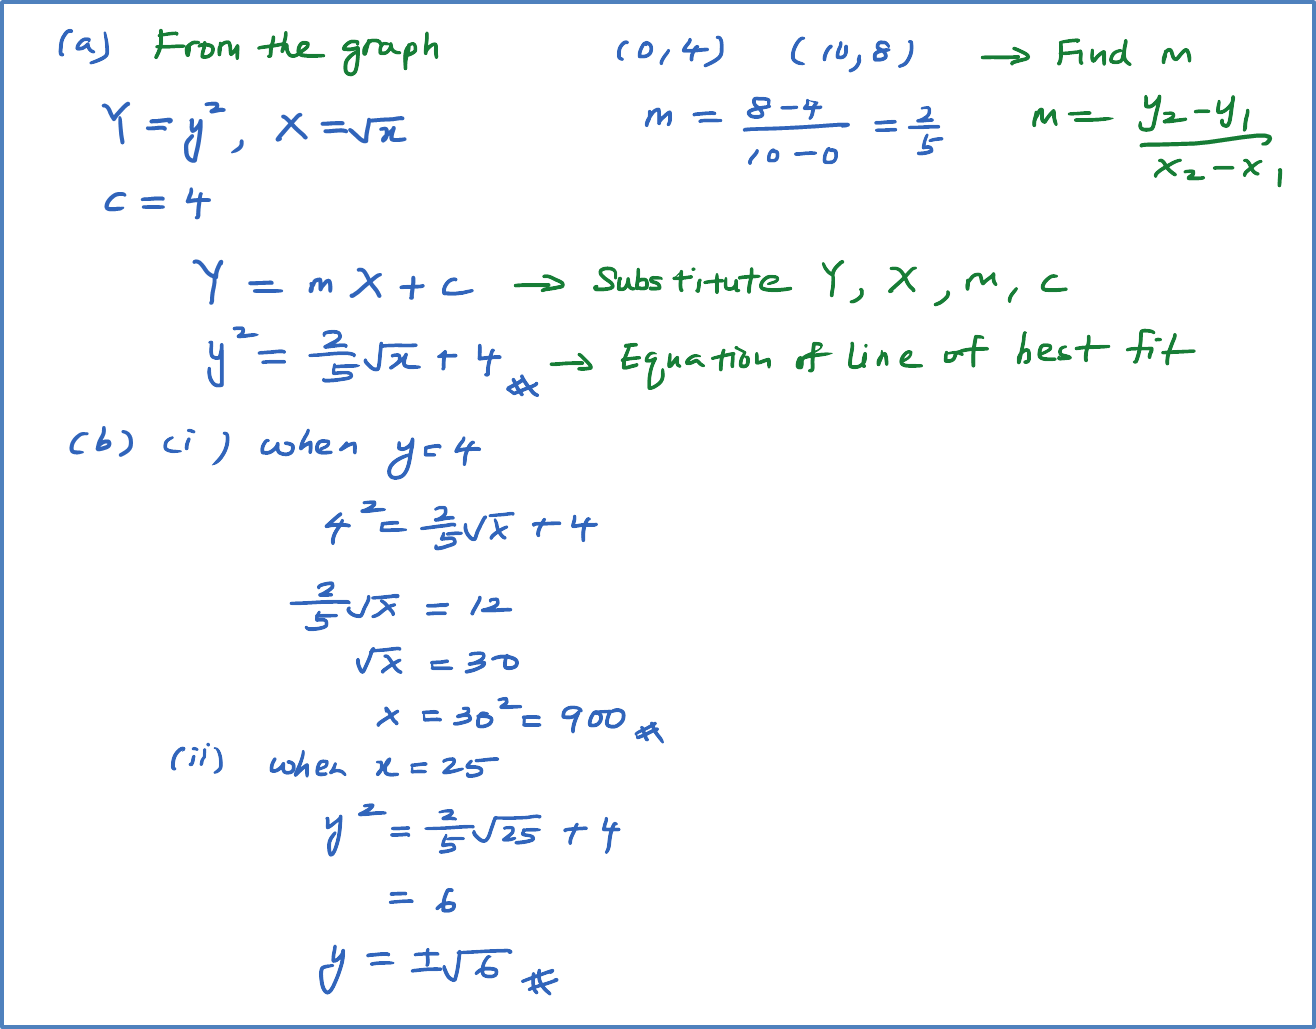
The diagram shows a line of best fit by plotting a graph of against .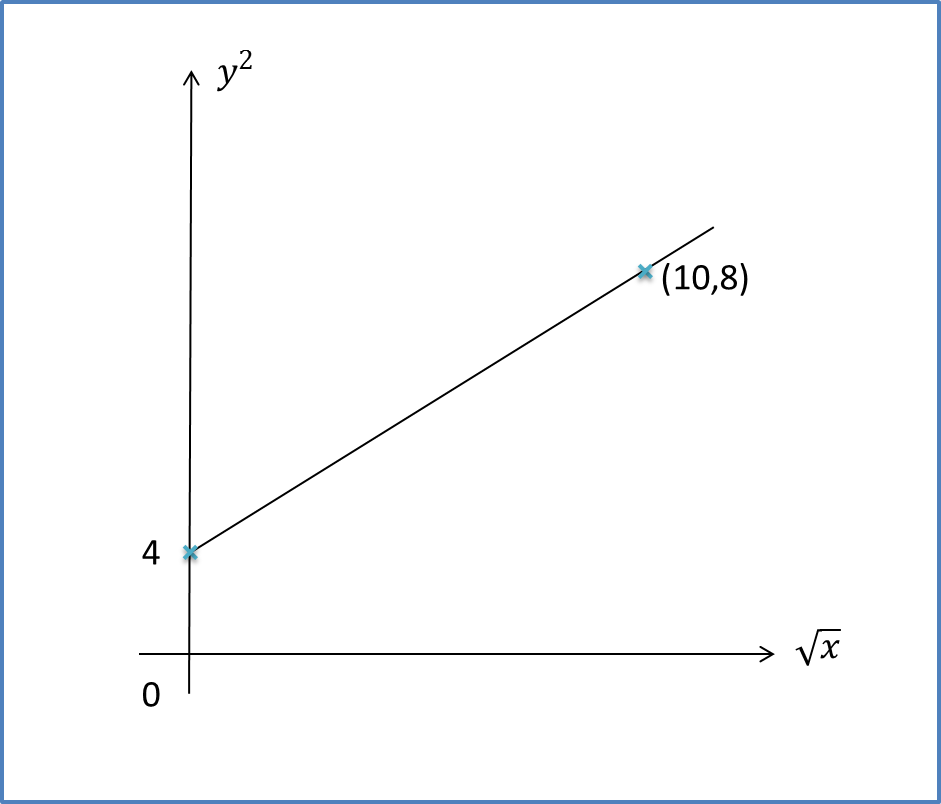
- Find the equation of the line of best fit.
- Determine the value of
- x when y = 4,
- y when x = 25.
Solution:
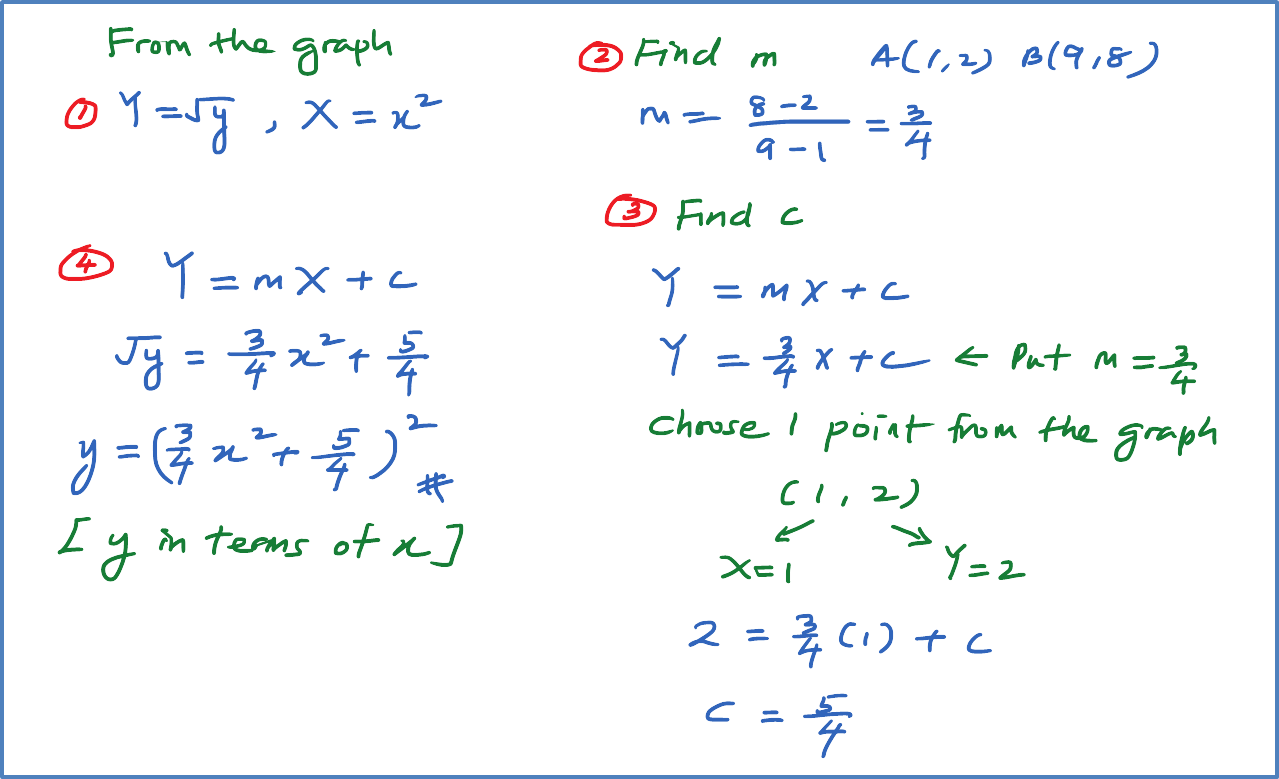
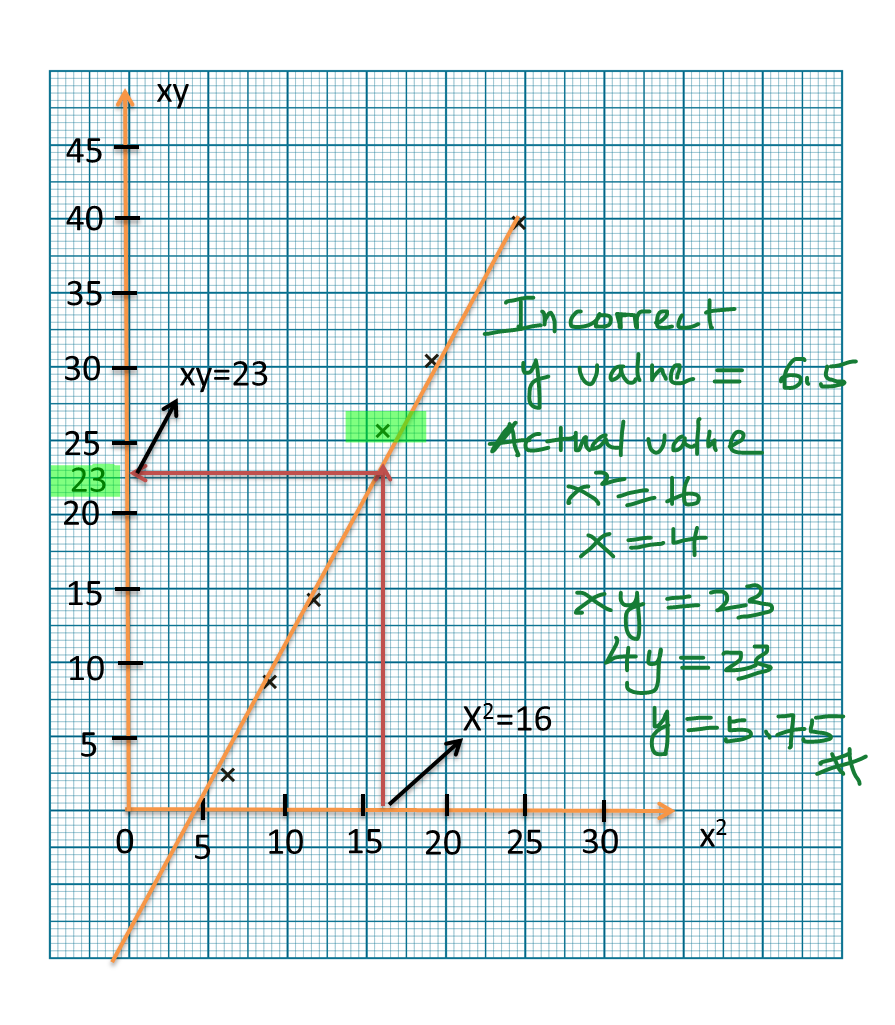
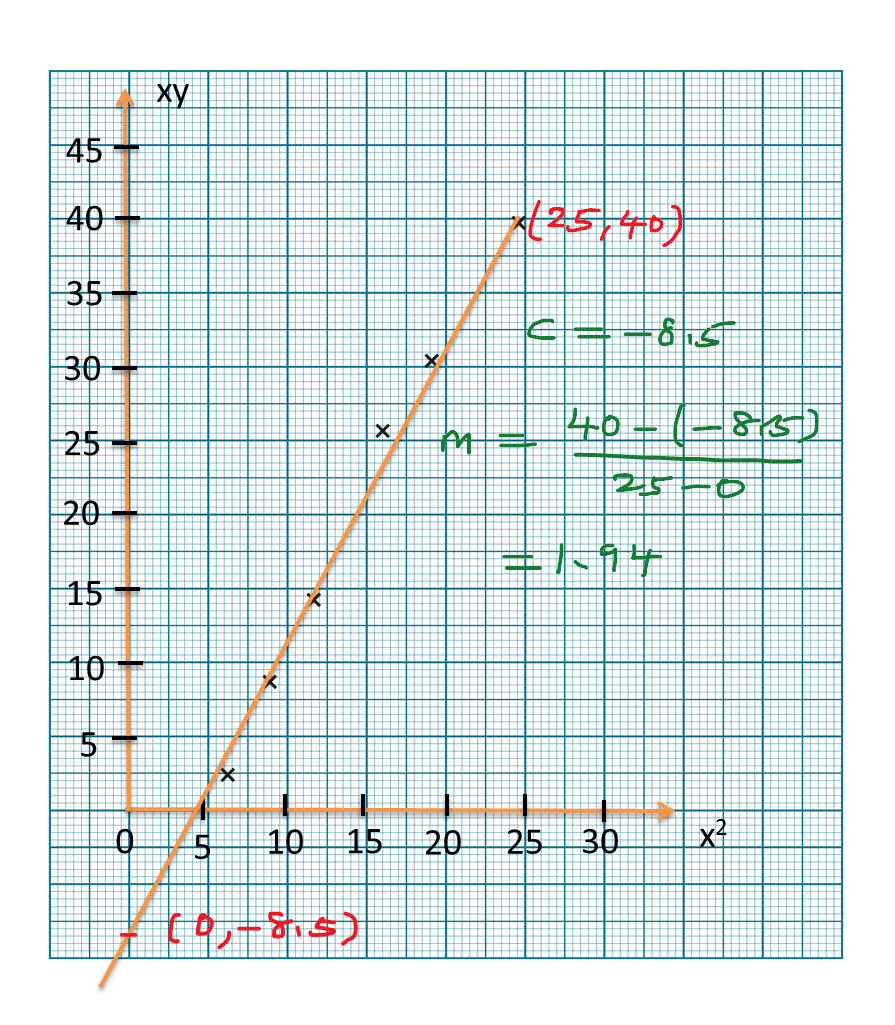
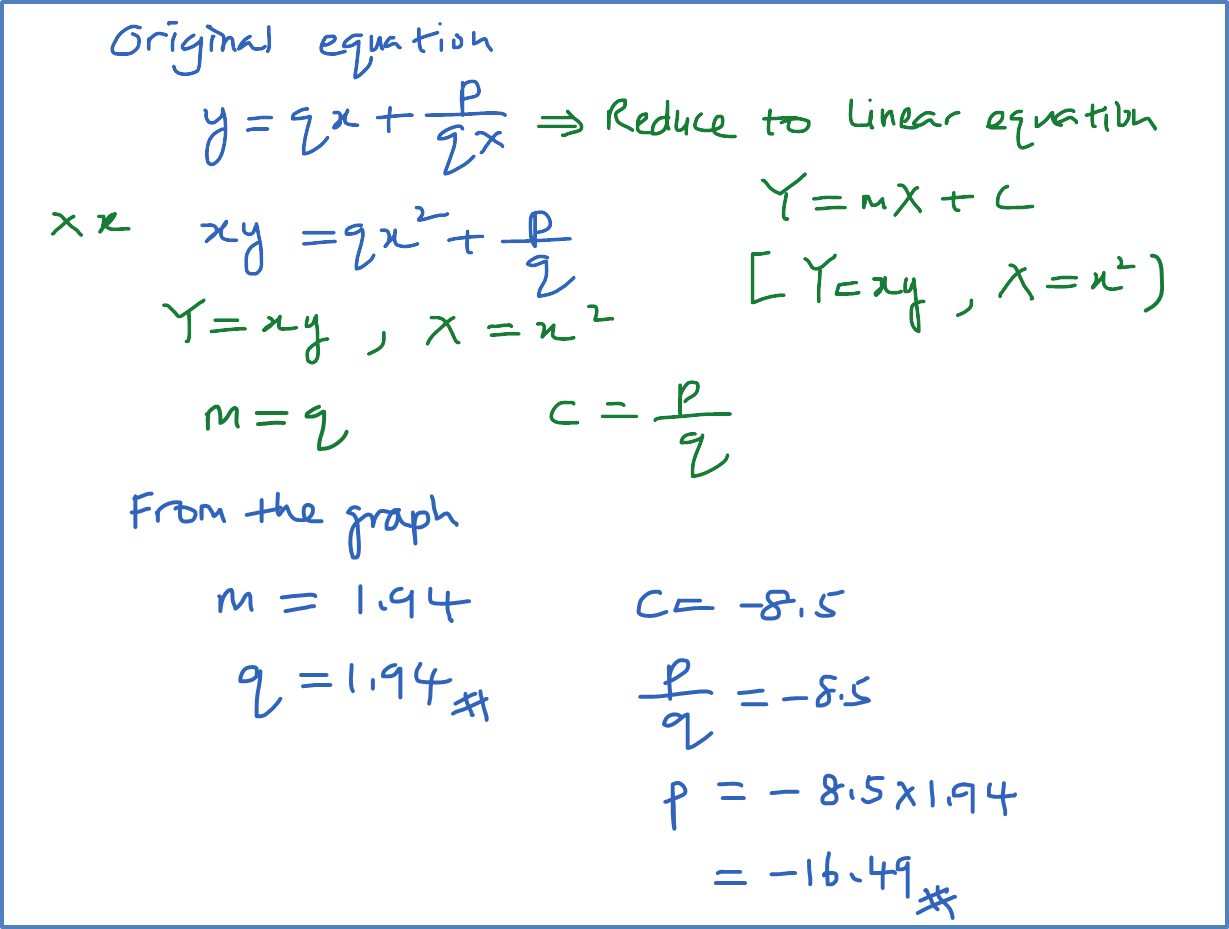
Question 3:
The diagram shows part of the straight line graph obtained by plotting against .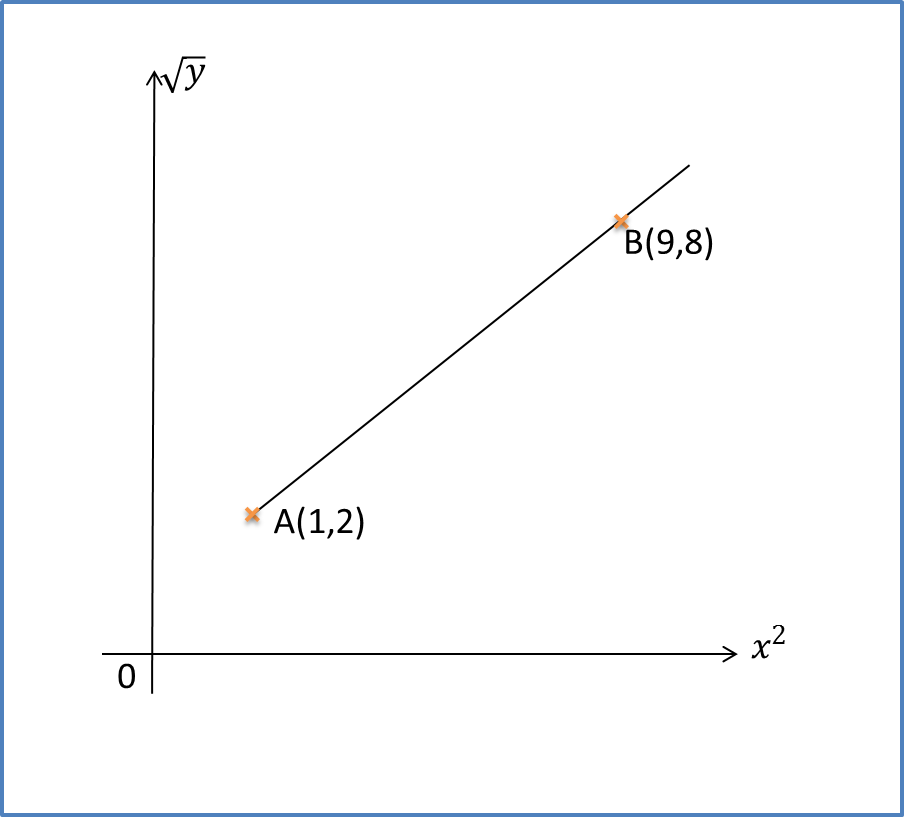
Express y in terms of x.
Solution: