8.1 Radians
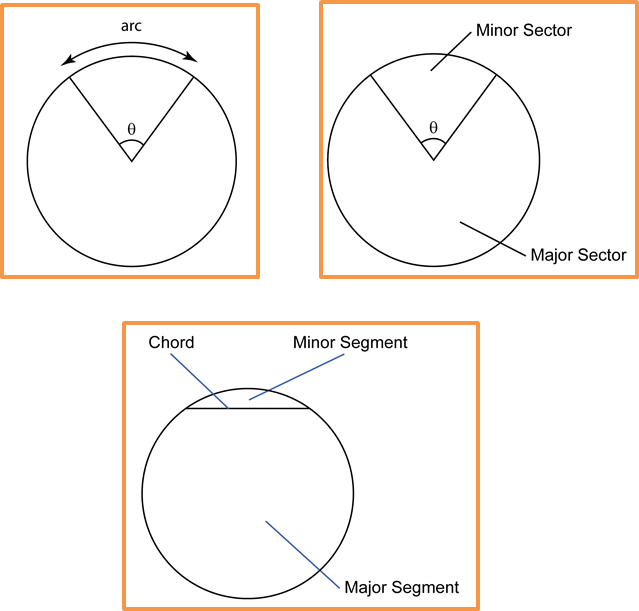
(A) Terminology:
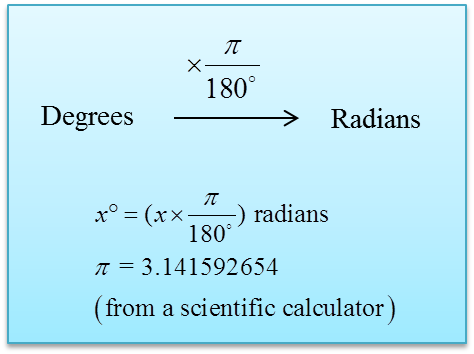
(B) Convert degrees to radians:
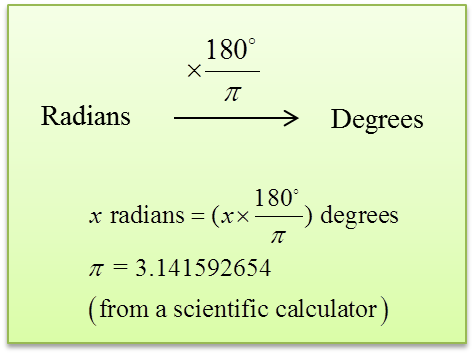
(C) Convert radians to degrees:
(A) Terminology:
(B) Convert degrees to radians:
(C) Convert radians to degrees:
Long Questions (Question 5 & 6)
Question 5:
Solution:
(a)
(b)
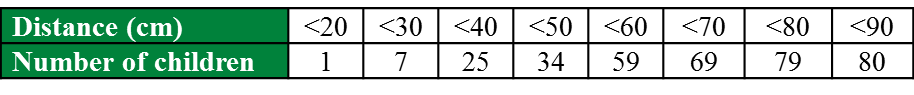
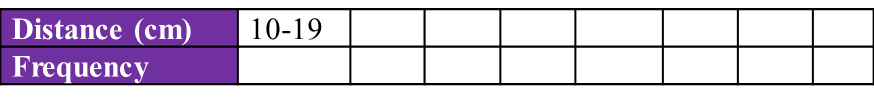
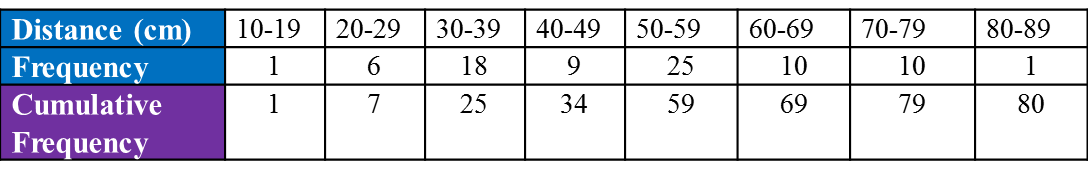
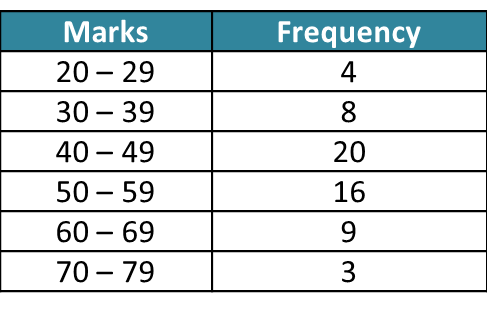
The table shows the cumulative frequency distribution for the distance travelled by 80 children in a competition.
(a) Based on the table above, copy and complete the table below.
(b) Without drawing an ogive, estimate the interquartile range of this data.
Solution:
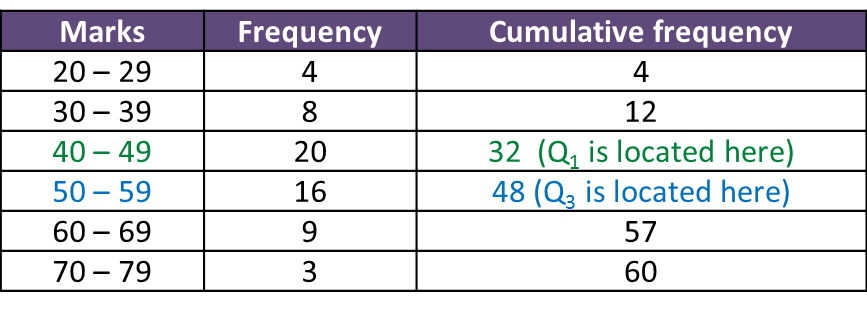
(a)
(b)
Interquartile range = Third Quartile – First Quartile
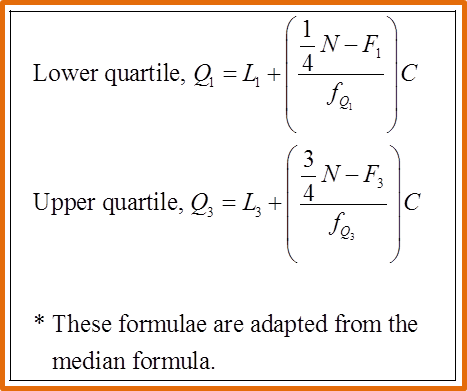
Third Quartile class, Q3 = ¾ × 80 = 60
Therefore third quartile class is the class 60 – 69.
First Quartile class, Q1= ¼ × 80 = 20
Therefore first quartile class is the class 30 – 39.
Question 6:
Solution:
Substitute (1) into (2):
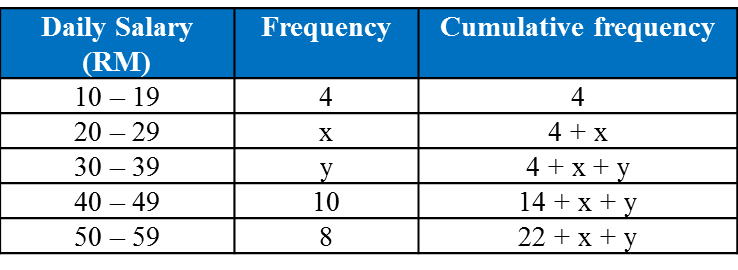
Table shows the daily salary obtained by 40 workers in a construction site.
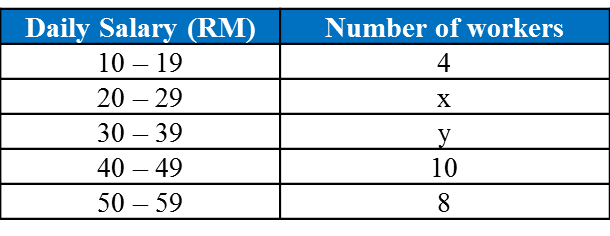
Given that the median daily salary is RM35.5, find the value of x and of y.
Hence, state the modal class.
Total workers = 40
22 + x + y = 40
x = 18 – y ------(1)
Median daily salary = 35.5
Median class is 30 – 39
Substitute (1) into (2):
3y = 80 – 5(18 – y)
3y = 80 – 90 + 5y
–2y = –10
y = 5
Substitute y = 5 into (1)
x = 18 – 5 = 13
Thus x = 13 and y = 5.
The modal class is 20 – 29 daily salary (RM).
Long Questions (Question 3 & 4)
Question 3:
Solution:
(a)
(b)
The mean of the data 1, a, 2a, 8, 9 and 15 which has been arranged in ascending order is b. If each number of the data is subtracted by 3, the new median is
. Find
(a) The values of a and b,
(b) The variance of the new data.
Solution:
(a)
(b)
New data is (1 – 3), (3 – 3), (6 – 3), (8 – 3), (9 – 3), (15 – 3)
New data is – 2, 0, 3, 5, 6, 12
Question 4:
(b) A sum of certain numbers is 72 with mean of 9 and the sum of the squares of these numbers of 800, is taken out from the set of 20 numbers. Calculate the mean and variance of the remaining numbers.
Solution:
(a)
(b)
A set of data consists of 20 numbers. The mean of the numbers is 8 and the standard deviation is 3.
(a) Calculate
and
.
(b) A sum of certain numbers is 72 with mean of 9 and the sum of the squares of these numbers of 800, is taken out from the set of 20 numbers. Calculate the mean and variance of the remaining numbers.
Solution:
(a)
(b)
Long Questions (Question 1 & 2)
Question 1:
Given that the median age is 35.5, find the value of m and of n.
Solution:
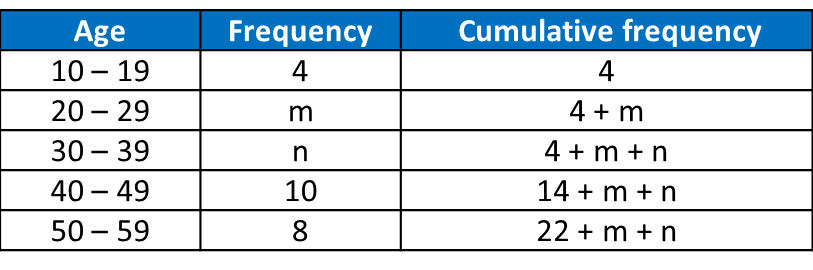
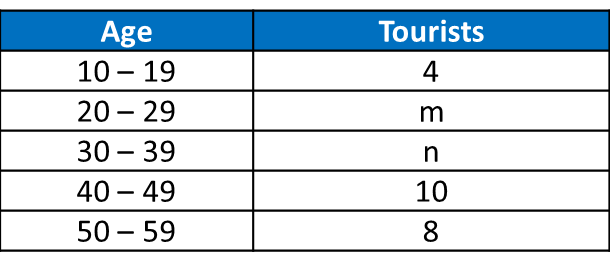
Table shows the age of 40 tourists who visited a tourist spot.
Given that the median age is 35.5, find the value of m and of n.
Given that the median age is 35.5, find the value of m and of n.
22 + m + n = 40
n = 18 – m -----(1)
Given median age = 35.5, therefore median class = 30 – 39
6n = 160 – 10m
3n = 80 – 5m -----(2)
Substitute (1) into (2).
3 (18 – m) = 80 – 5m
54 – 3m = 80 – 5m
2m = 26
m = 13
Substitute m = 13 into (1).
n = 18 – 13
n = 5
Thus m = 13, n = 5.
Question 2:
(b) Each mark is multiplied by 2 and then 3 is added to it.
Solution:
(a)(i)
(a)(ii)
(b)(i)
A set of examination marks x1, x2, x3, x4, x5, x6 has a mean of 6 and a standard deviation of 2.4.
(a) Find
(i) the sum of the marks,
,
(ii) the sum of the squares of the marks,
.
(b) Each mark is multiplied by 2 and then 3 is added to it.
Find, for the new set of marks,
(i) the mean,
(ii) the variance.
(a)(i)
(a)(ii)
(b)(i)
Mean of the new set of numbers
= 6(2) + 3
= 15
(b)(ii)
Variance of the original set of numbers
= 2.42 = 5.76
Variance of the new set of numbers
= 22 (5.76)
= 23.04
Short Questions (Question 10 & 11)
Question 10:
A set of data consists of twelve positive numbers.
Find
(a) the variance
(b) the mean
Solution:
(a)
(b)
A set of data consists of twelve positive numbers.
Find
(a) the variance
(b) the mean
Solution:
(a)
(b)
Question 11 (4 marks):
A set of data consists of 2, 3, 4, 5 and 6. Each number in the set is multiplied by m and added by n, where m and n are integers. It is given that the new mean is 17 and the new standard deviation is 4.242.
Find the value of m and of n.
Solution:
A set of data consists of 2, 3, 4, 5 and 6. Each number in the set is multiplied by m and added by n, where m and n are integers. It is given that the new mean is 17 and the new standard deviation is 4.242.
Find the value of m and of n.
Solution:
Short Questions (Question 5 & 6)
Question 5:
A set of data consists of 9, 2, 7, x2 – 1 and 4. Given the mean is 6, find
(a) the positive value of x,
(b) the median using the value of x in part (a).
Solution:
(a)
(b)
Arrange the numbers in ascending order
2, 4, 7, 8, 9
Median = 7
A set of data consists of 9, 2, 7, x2 – 1 and 4. Given the mean is 6, find
(a) the positive value of x,
(b) the median using the value of x in part (a).
Solution:
(a)
(b)
Arrange the numbers in ascending order
2, 4, 7, 8, 9
Median = 7
Question 6:
A set of seven numbers has a standard deviation of 3 and another set of three numbers has a standard deviation of 4. Both sets of numbers have an equal mean.
If the two sets of numbers are combined, find the variance.
Solution:
A set of seven numbers has a standard deviation of 3 and another set of three numbers has a standard deviation of 4. Both sets of numbers have an equal mean.
If the two sets of numbers are combined, find the variance.
Solution:
Short Questions (Question 3 & 4)
Question 3:
The mean of five numbers is
. The sum of the squares of the numbers is 120 and the standard deviation is 2q. Express p in terms of q.
Solution:Question 4:
Solution:
A set of positive integers consists of 1, 4 and p. The variance for this set of integers is 6. Find the value of p.
Solution:
Short Questions (Question 1 & 2)
Question 1:
Solution:
Given that the standard deviation of five numbers is 6 and the sum of the squares of these five numbers is 260. Find the mean of this set of numbers.
Solution:
Question 2:
Both of the mean and the standard deviation of 1, 3, 7, 15, m and n are 6. Find
Both of the mean and the standard deviation of 1, 3, 7, 15, m and n are 6. Find
(a) the value of m + n,
(b) the possible values of n.
Solution:
(a)1 + 3 + 7 + 15 + m + n= 36
26 + m + n= 36
m + n = 10
(b)
Measures of Dispersion (Part 3)
Measures of Dispersion (Part 3)
7.3 Variance and Standard Deviation
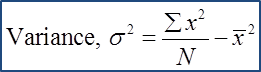
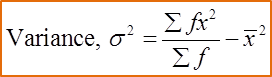
1. The variance is a measure of the mean for the square of the deviations from the mean.
7.3 Variance and Standard Deviation
1. The variance is a measure of the mean for the square of the deviations from the mean.
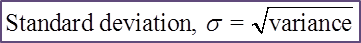
2. The standard deviation refers to the square root for the variance.
(A) Ungrouped Data
Example 1:
Solution:
Find the variance and standard deviation of the following data.
15, 17, 21, 24 and 31
Solution:
(B) Grouped Data (without Class Interval)
Example 2:
Find the variance and standard deviation of the data.
Example 2:
The data below shows the numbers of children of 30 families:
Number of child |
2 |
3 |
4 |
5 |
6 |
7 |
8 |
Frequency |
6 |
8 |
5 |
3 |
3 |
3 |
2 |
Find the variance and standard deviation of the data.
Solution:
(C) Grouped Data (with Class Interval)

Example 3:
Solution:
Example 3:
Daily Salary(RM) |
Number of workers |
10 – 14 |
40 |
15 – 19 |
25 |
20 – 24 |
15 |
25 – 29 |
12 |
30 – 34 |
8 |
Find the mean of daily salary and its standard deviation.
Solution:
Daily Salary (RM) |
Number of workers, f |
Midpoint, x |
fx |
fx2 |
10 – 14 |
40 |
12 |
480 |
5760 |
15 – 19 |
25 |
17 |
425 |
7225 |
20 – 24 |
15 |
22 |
330 |
7260 |
25 – 29 |
12 |
27 |
324 |
8748 |
30 – 34 |
8 |
32 |
256 |
8192 |
Total |
100 |
1815 |
37185 |
Measures of Dispersion (Part 2)
Measures of Dispersion (Part 2)
7.2b Interquartile Range 2
7.2b Interquartile Range 2
(C) Interquartile Range of Grouped Data (with Class Interval)
The interquartile range of grouped data can be determined by Method 1 (using a cumulative frequency table) or Method 2 (using an ogive).
Example:
The table below shows the marks obtained by a group of Form 4 students in school mathematics test.
Estimate the interquartile range.
Step 3:
Step 4:
The table below shows the marks obtained by a group of Form 4 students in school mathematics test.
Estimate the interquartile range.
Solution:
Upper quartile, Q3 = the observation
= the 45thobservation
Step 2:
Method 1: From Cumulative Frequency Table
Step 1:
Lower quartile, Q1 = the
observation
= the 15thobservation
Upper quartile, Q3 = the observation
= the 45thobservation
Step 2:
Step 3:
Step 4:
Interquartile Range
= upper quartile – lower quartile
= Q3– Q1
= 57.625 – 41
= 16.625