Measures of Dispersion (Part 2)
7.2b Interquartile Range 1
7.2b Interquartile Range 1
(A) Interquartile Range of Ungrouped Data
Example 1:
Find the interquartile range of the following data.
(a) 7, 5, 1, 3, 6, 11, 8
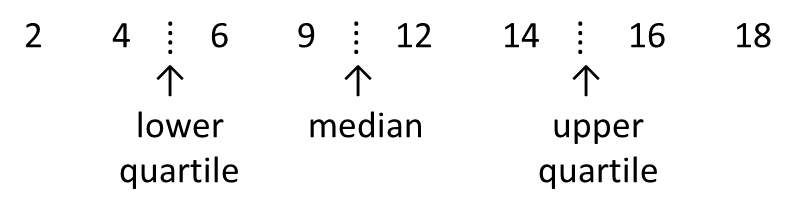
(b) 12, 4, 6, 18, 9, 16, 2, 14
Solution:
(a) Rearrange the data according to ascending order.

(b) Rearrange the data according to ascending order.
Solution:
(a) Rearrange the data according to ascending order.
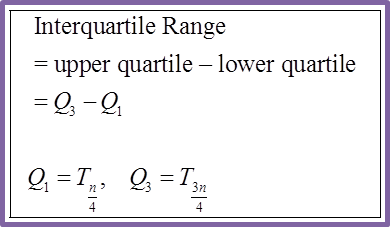
Interquartile Range
= upper quartile – lower quartile
= 8 – 3
= 5 (b) Rearrange the data according to ascending order.
Interquartile Range
= upper quartile – lower quartile
=
= 15 – 5
= 10
= 10
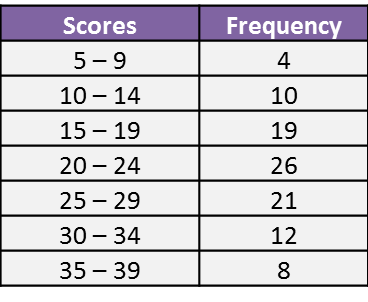
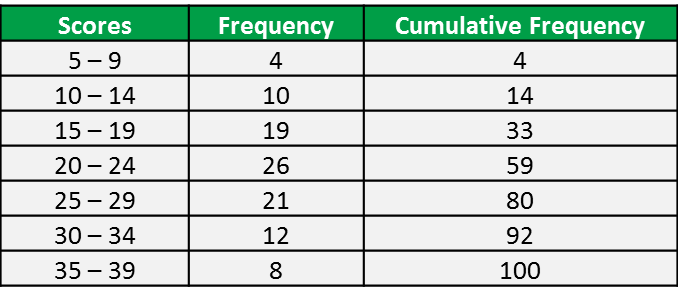
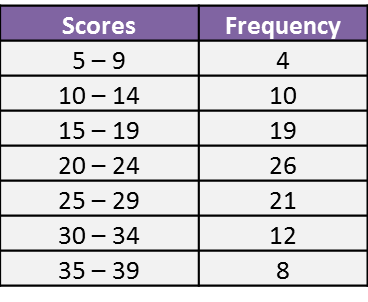
(B) Interquartile Range of Grouped Data (without Class Interval)
Determine the interquartile range of the distribution.

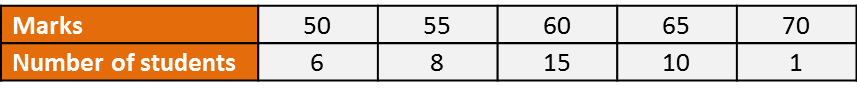
Example 2:
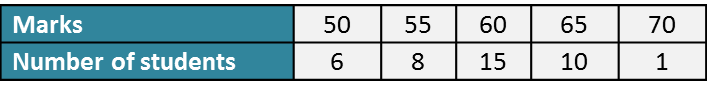
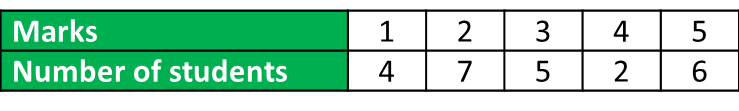
The table below shows the marks obtained by a group of Form 4 students in school mid-term science test.
Determine the interquartile range of the distribution.
Solution:
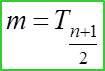
Lower quartile, Q1 = the
observation
= the 6thobservation
= 2
Upper quartile, Q3 = the
observation
= the 18thobservation
= 4
Interquartile Range
= upper quartile – lower quartile
= Q3– Q1
= 4 – 2
= 2