3.1b Determining the Image of an Object under Combination of (a) Two Enlargements or (b) an Enlargement and an Isometric Transformation
1. Enlargement is a transformation where all points of an object on a plane move from a fixed point at a constant ratio.
2. The fixed point is called the centre of enlargement and constant ratio is called the scale factor.
3. For enlargement, the object and the image are similar.
4. Area of image = (Scale factor)2 × Area of object
= k2 × Area of object
Example:
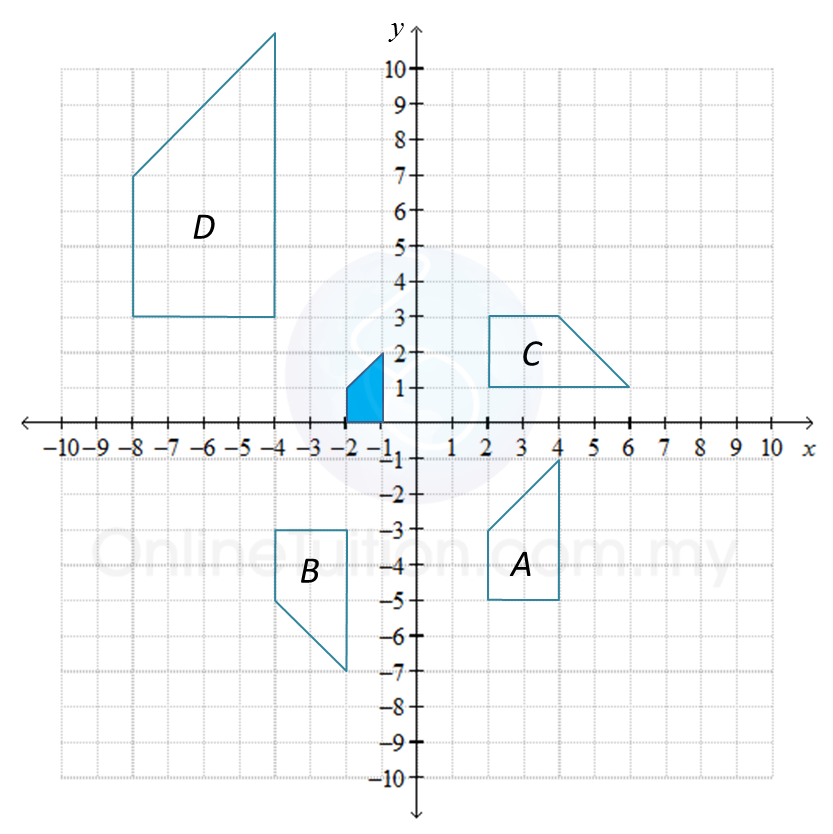
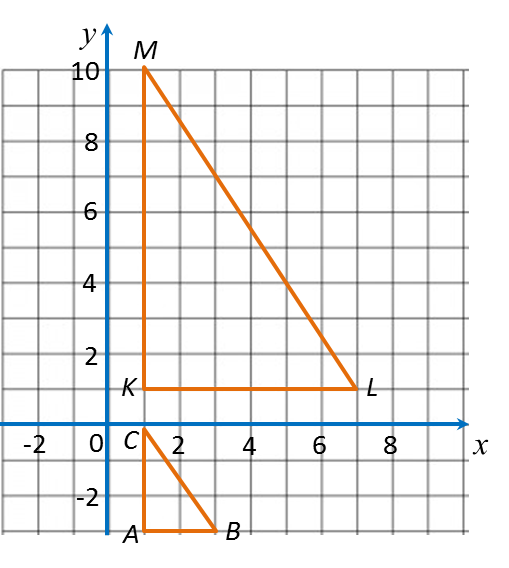
E, P and T are three transformations that are defined as follows:
E = Enlargement with centre V (0, –1) and a scale factor of 2.
P = Reflection at the line y = –1.
Based on the diagram above, determine the image of the shaded figure under the combined transformations
(a) E2 (b) ET (c) EP
Solution:

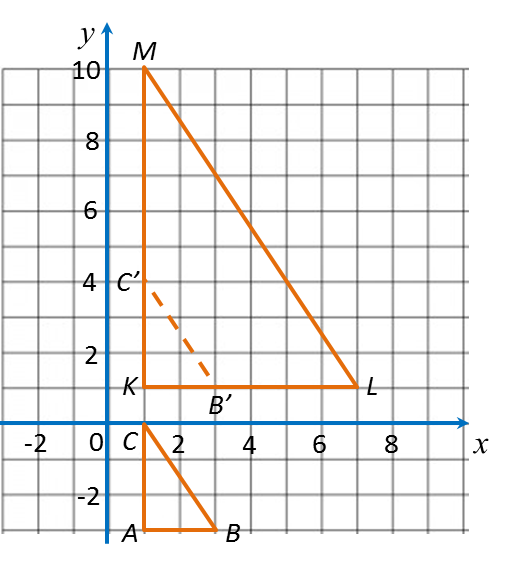
(a)
Shaded figure → (E) figure III → (E) figure D.
Hence, the image of the shaded figure under the combined transformation E2 = EE is the figure D.
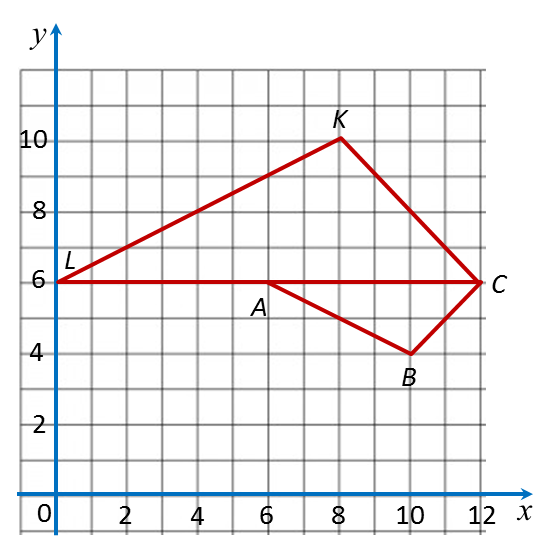
(b)
Shaded figure → (T) figure II → (E) figure A.
Hence, the image of the shaded figure under the combined transformation ET is the figure A.
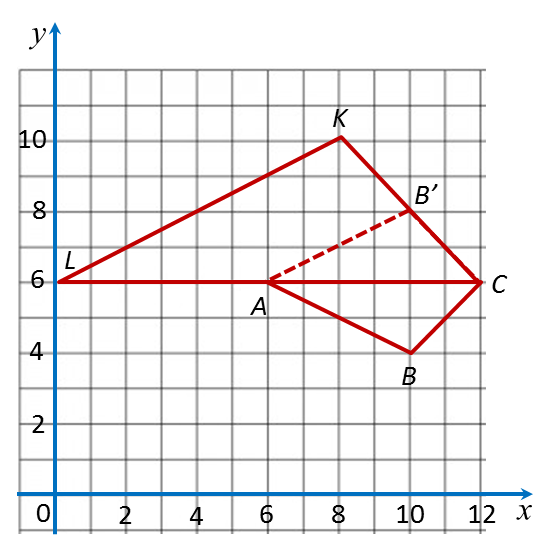
(c)
Shaded figure → (P) figure I → (E) figure B.
Hence, the image of the shaded figure under the combined transformation EP is the figure B.