15.1 Trigonometry


15.1 Trigonometry
 
15.1.1 Trigonometrical Ratios of an Acute Angle

1.    


2.   Hypotenuse is the longest side of the right-angled triangle which is opposite the right angle.
3.   Adjacent side is the side, other than the hypotenuse, which has direct contact with the given angle, θ.
4.   Opposite side is the side which is opposite the given angle, θ.
5.   In a right-angled triangle,

     sinθ= opposite side hypotenuse      cosθ= adjacent side hypotenuse   tanθ= opposite side adjacent side      

6.
When the size of an angle θ increases from 0o to 90o,

· sin θ increases.
· cos θ increases.
· tan θ increases.

7.   The values of sin θ, cos θ and tan θ remain the same even though the size of the triangle has changed.
Example:

Find the sine, cosine and tangent of the give angle, θ, in triangle ABC.

Solution:
sin θ = B C A B = 8 17 cos θ = A C A B = 15 17 t a n θ = B C A C = 8 15
 

15.1.2  Values of Tangent, Sine and Cosine
1.   The values of the trigonometric ratios of 30o, 45o and 60o (special angle) are as below.


2.   1 degree is equal to 60 minutes.
1o= 60’

3.   A scientific calculator can be used to find the value of the sine, cosine or tangent of an angle.
Example:
sin 40.6o = 0.5954
 
Calculator Computation
    Press [sin] [40.6] [=] 0.595383839
4.   Given the values of sine, cosine and tangent, we can find the angles using a scientific calculator.
Example:
tan x = 1.7862
  x = 67o30’
 
Calculator Computation
Press [shift] [tan][1.7862]
 [=][o’’’]  67o30’

14.2.3 Ratio, Rates and Proportions II, PT3 Focus Practice


Question 10:
Diagram below shows the distance from Town P to Town Q and Town Q to Town R.
(a) Rahim rode his bicycle from Town P at 9.00 a.m. and took 2 hours to reach Town Q.
What is the speed, in km/h, of the bicycle?
(b) Rahim took 30 minutes rest at Town Q and continued his journey to Town R three times faster than his earlier speed.
State the time he reached Town R.

Solution:
(a)
The speed of the bicycle from Town P to Town Q = Distance Time = 10 2 =5 km/h

(b)
Speed= Distance Time Rahim took 30 minutes rest at Town Q. Time taken when his journey to Town R three times faster than his earlier speed. = 25 5×3 = 5 3 =1 2 3  hours =1 hour 40 minutes  2 3 ×60 =40 minutes Total time taken from Town P to Town Q and Town Q to Town R =2 hours +30 minutes+1 hour 40 minutes =4 hour 10 minutes The time he reached Town R at 1.10 p.m.


Question 11:
Diagram below shows a trailer travelling from a factory to location P and location P to location Q. The trailer departs at 8.00 a.m.


(a) Based on the Table, calculate the total mass, in tonne, of the trailer and its load.
(b) The trailer arrived at location P at 10.00 a.m. and it stopped for 1½ hours to unload half of the concrete pipes. The trailer then continued its journey to location Q two times faster than its earlier speed. State the time, the trailer reached at location Q.

Solution:
(a)
Mass of concrete pipe on the trailer =500 kg×8 =4000 kg = 4000 1000 =4 tonnes Total mass of the trailer and its load =1.5+4.0 =5.5 tonnes

(b)
Speed= Distance Time Time taken to travel from the Factory to Location P =10.00 a.m.8.00 a.m. =2 hours Speed of the trailer = 80 2 =40 km/h It stopped for 1 1 2  hours to unload half of the concrete pipes. Time taken to continue its journey to Location Q = Distance Speed = 200 40×2 =2 1 2  hours The time the trailer reached at Location Q =1400 hours or 2.00 p.m.


Question 12:
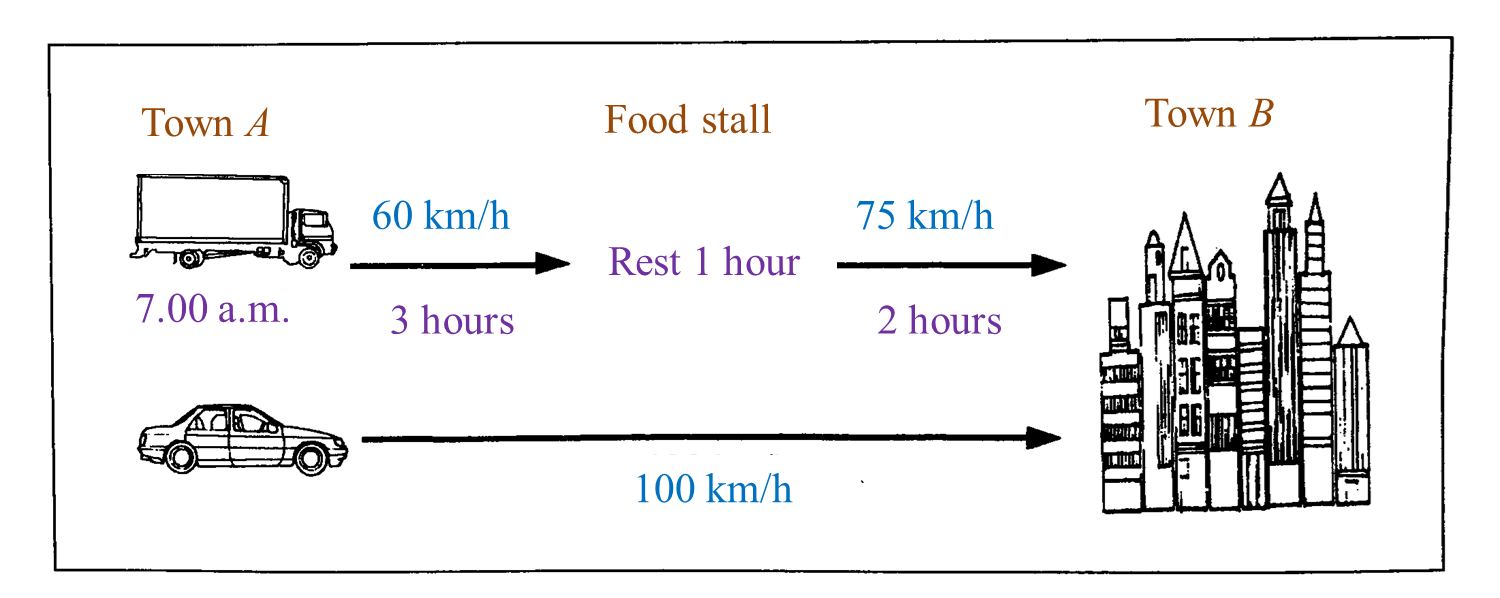
Diagram below shows travel information of Jason and Mary from Town A to Town B. Jason drives a lorry while Mary drives a car.

(a) Jason started his journey from Town A at 7.00 a.m.
State the time, Jason reached at Town B.
(b) If both of them reached Town B at the same time, state the time Mary started her journey from Town A.

Solution:
(a)
Total time taken from Town A to Town B
= 3 hours + 1 hour + 2 hours
= 6 hours

Time Jason reached Town B
= 0700 + 0600
= 1300 hours → 1.00 p.m.

(b)
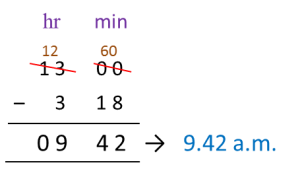
Speed= Distance Time Total distance from Town A to Town B =( 60×3 )+( 75×2 ) =180+150 =330 km Time taken by Mary = 330 100 =3.3 hours =3 hours 18 minutes  0.3×60 =18 minutes The time Mary started her journey from Town A=9.42 a.m.


14.2.2 Ratio, Rates and Proportions II, PT3 Focus Practice


Question 6:
Mei Ling drives her car from Kuantan to Kuala Terengganu for a distance of 170 km for 2 hours. She then continues her journey to Kota Bahru and increases her speed to 100 kmh-1 for 45 minutes.
Calculate the acceleration, in kmh-2, of the car.

Solution:
Speed from Kuantan to Kuala Terengganu = 170 2 =85  kmh 1 Acceleration = Final speedInitial speed Time taken = 10085 45 60 =20  kmh 2


Question 7:
Diagram shows the distance between K and L.

A car moves from K to L with an average speed of 80 kmh-1. After rest for 1 hour 30 minutes, the car then returns to K. The average speed of the car from L to K increases 20%. If the car reaches K at 5 p.m., calculate the time the car starts its journey from K.

Solution
The time taken from K to L = 160 80 =2 hrs The average speed from L to K =80×1.2 =96  kmh 1 The time taken from L to K = 160 96 =1 2 3  hrs The total time taken for the whole journey =2+1 1 2 +1 2 3 =5 1 6  hrs =5 hour 10 minutes


The car starts its journey from K at 11:50 a.m.


Question 8:
Mr Wong is going to watch a movie at 2.30 p.m at a cinema that is 60 km away from his house. He leaves at 1.25 p.m and drives at an average speed of 70 km/h for half an hour. If he drives at an average speed of 75 km/h for the remaining journey, will he arrive before the movie starts?
Give your reason with calculation.

Solution
Distance travelled at the first  1 2  hour =70× 1 2 =35 km Remaining distance=60 km35 km    =25 km Time taken for the remaining journey = 25 75 = 1 3 ×60 =20 minutes Mr Wong arrives at =1.25 p.m+30 minutes+20 minutes =2.15 p.m Yes, he will arrive before 2.30 p.m


Question 9:
Karen drives her car from town P to town Q at an average speed of 80 km/h for 2 hours 15 minutes. She continues her journey for a distance of 90 km from town Q to town R and takes 45 minutes.
Calculate the average speed, in km/h, for the journey from P to R.

Solution:
From P to Q: Average speed=80 km/h Time taken = 2 hours 15 minutes                    = 2 1 4  hours Distance=average speed×time taken Distance =80×2 1 4                =80× 9 4                =180 km From Q to R: Distance =90 km Time taken = 45 minutes                    =  3 4  hour Average speed from P to R = 180+90 2 1 4 + 3 4 Total distance Total time = 270 3 =90 km/h

14.2.1 Ratio, Rates and Proportions II, PT3 Focus Practice


Question 1:
The distance from town A to town B is 120 km. A car leaves town A for town B at 11.00 a.m. The average speed is 80 km h-1 .
At what time does the car arrive at town B.

Solution:
Time taken= distance travelled average speed = 120 km 80  km h 1 = 3 2  hours = 1 hour 30 minutes 1 hour 30 minutes after 11.00 a.m. is 12.30 p.m.


Question 2:
Kenny drives his car from town P to town Q at a distance of 180 km in 3 hours.
Faisal takes 30 minutes less than Kenny for the same journey.
Calculate the average speed, in km/h, of Faisal’s car.

Solution:
Time taken by Faisal = 3 hours30 minutes = 3 hours 1 2  hour = 2 1 2  hours Average speed of Faisal's car = distance travelled time taken = 180 km 2 1 2  hours =72 km/h


Question 3:
Rafidah drives her car from town L to town M at an average speed of 90 km/h for 2 hours 40 minutes. She continues her journey for a distance of 100 km from town M to town N and takes 1 hour 20 minutes.
Calculate the average speed, in km/h, for the journey from L to M.

Solution:
Distance=average speed×time taken Distance from L to M=90×2 40 60   =90×2 2 3   =90× 8 3   =240 km Total distance from L to N=240+100   =340 km Total time taken = 2 hours 40 minutes + 1 hour 20 minutes    = 4 hours Average speed for the journey from L to N= 340 km 4 h    =85 km/h


Question 4:
Susan drives at an average speed of 105 km/h from town F to town G.
The journey takes 3 hours.
Susan takes 30 minutes longer for her return journey from town G to town F. Calculate the average speed, in km/h, for the return journey.

Solution:
Distance from F to G = 105 km/h×3 hours =315 km Average speed for return journey = distance travelled time taken = 315 km 3 1 2  hours =90 km/h


Question 5:
Table below shows the distances travelled and the average speeds for four vehicles.

Vehicle Distance (km) Average speed (km/h)
A 230 115
B 250 100
C 170 85
D 245 70
Which vehicles took the same time to complete the journey?

Solution:
Time taken for vehicle A= 230 115 =2 hours Time taken for vehicle B= 250 100 =2 1 2  hours Time taken for vehicle C= 170 85 =2 hours Time taken for vehicle D= 245 60 =3 1 2  hours

Thus, the vehicles A and C took the same time to complete the journey.

13.2.3 Graphs of Functions, PT3 Focus Practice


Question 7:
Use graph paper to answer this question.
Table below shows the values of two variables, x and y, of a function.


The x-axis and the y-axis are provided on the graph paper on the answer space.
(a) By using a scale of 2 cm to 5 units, complete and label the y-axis.
(b) Based on the table above, plot the points on the graph paper.
(c) Hence, draw the graph of the function.

Answer:


Solution:


Question 8:
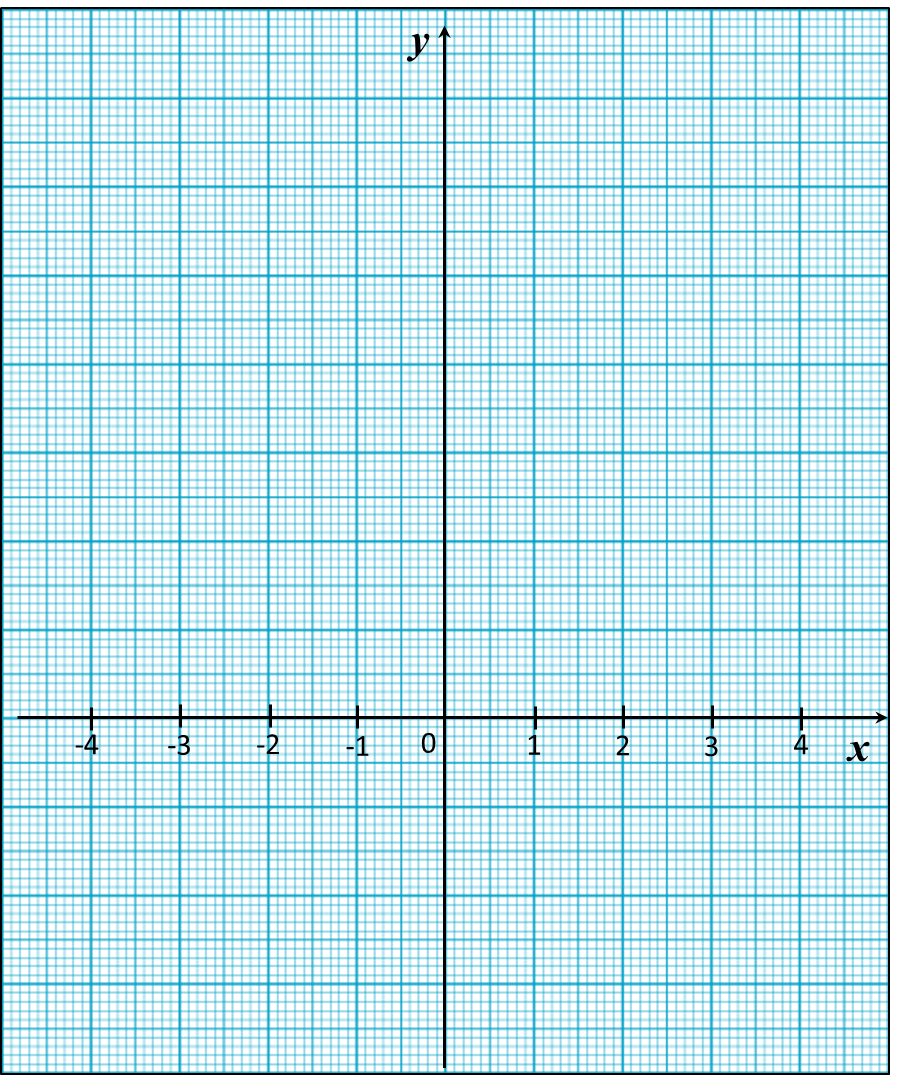
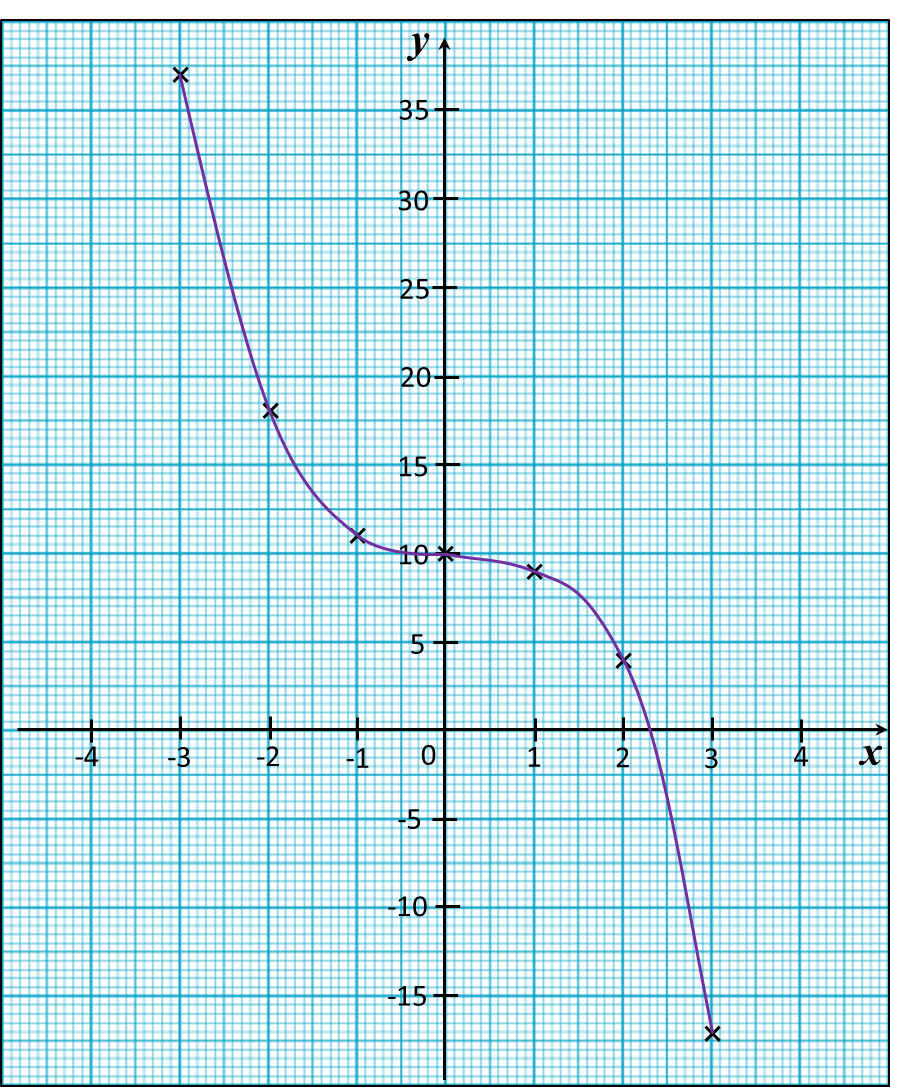
Use graph paper to answer this question.
Table below shows the values of two variables, x and y, of a function.


The x-axis and the y-axis are provided on the graph paper on the answer space.
(a) By using a scale of 2 cm to 2 units, complete and label the y-axis.
(b) Based on the table above, plot the points on the graph paper.
(c) Hence, draw the graph of the function.

Answer:


Solution:


13.2.2 Graphs of Functions, PT3 Focus Practice


13.2.2 Graphs of Functions, PT3 Focus Practice

Question 4:
Use graph paper to answer this question.
Table below shows the values of two variables, x and y, of a function.

x
–3
–2
–1
0
1
2
3
y
–19
–3
1
–1
–3
1
17
The x-axis and the y-axis are provided on the graph paper on the answer space.
(a) By using a scale of 2 cm to 5 units, complete and label the y-axis.
(b) Based on the table above, plot the points on the graph paper.
(c) Hence, draw the graph of the function.

Answer:


Solution:


Question 5:
Use graph paper to answer this question.
Table below shows the values of two variables, x and y, of a function.

x
–4
–3
–2
–1
0
1
2
y
31
17
7
1
–1
1
7
The x-axis and the y-axis are provided on the graph paper on the answer space.
(a) By using a scale of 2 cm to 5 units, complete and label the y-axis.
(b)   Based on the table above, plot the points on the graph paper.
(c) Hence, draw the graph of the function.


Answer:


Solution:


Question 6:
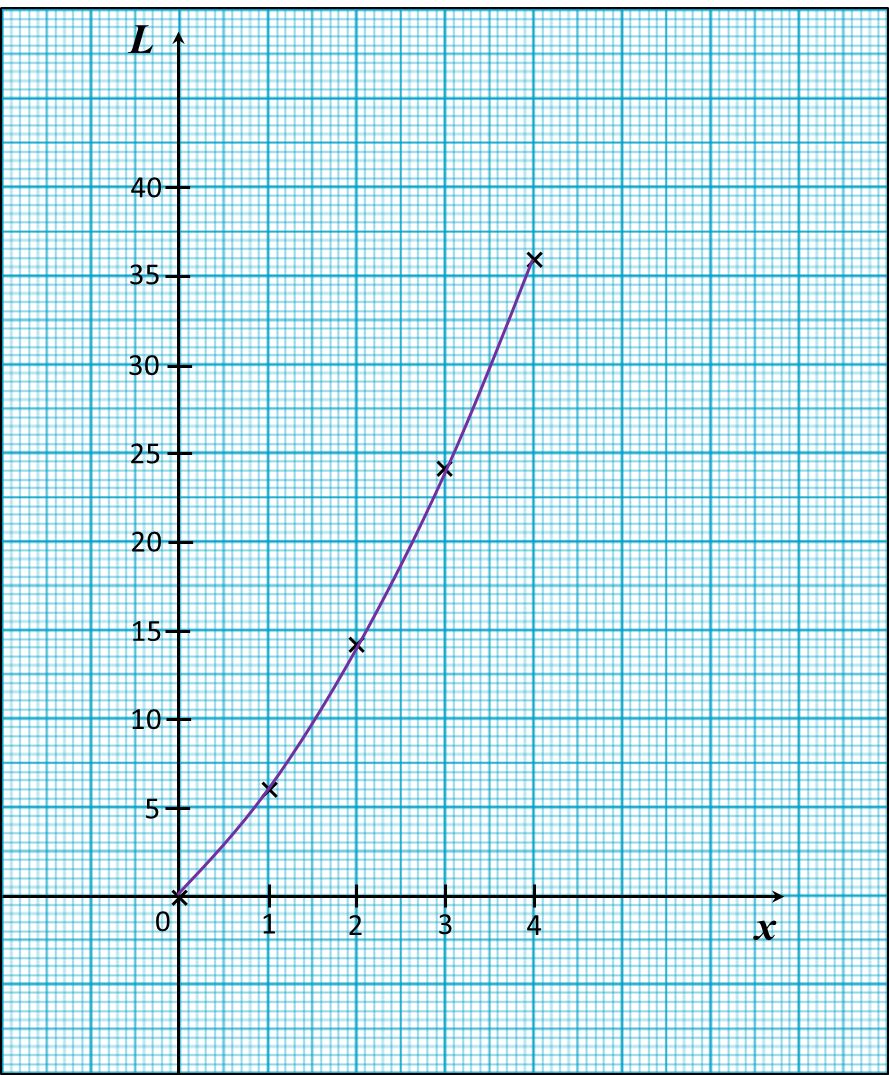
(a) Complete table below in the answer space for the equation L = x2 + 5x by writing the value of L when x = 2.
(b) Use graph paper to answer this part of the question. You may use a flexible curve rule.
By using a scale of 2 cm to 1 unit on the x-axis and 2 cm to 5 units on the y-axis, draw the graph of L = x2 + 5x for 0 ≤ x ≤ 4.

Answer:


Solution:
(a)
When x = 2
L = 22 + 5(2)
= 4 + 10
= 14  

(b)


13.2.1 Graphs of Functions, PT3 Focus Practice


13.2.1 Graphs of Functions, PT3 Focus Practice
 
Question 1:
 
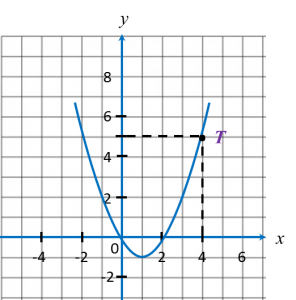
In the figure shown, when x = 4, the value of y is

Solution:
 
is the point on the graph where x = 4.
Hence, when x = 4, y = 5.


Question 2:
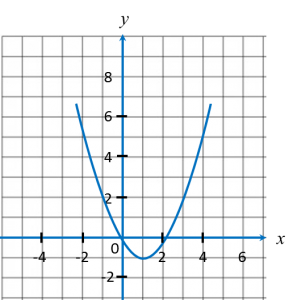
Diagram shows the graph of a function on a Cartesian plane.
 
The equation that represents the function is
 
Solution:
Use points (0, 6) and (-3, 0) to determine the function.

Function
Value of y when
x = 0
x = –3
y = x + 3
3
0
y = x – 3
–3
–6
y = 2x + 6
6
0 (correct)
y = 2x – 6
–6
–12

Question 3:
Table below shows the values of variables x and y of a function.
 
x
–2
0
1
y
–6
2
3
Which of the following functions is satisfied by the ordered pair?
A = 7x + 2
B = x3 + 2
C = x + x2 – 2
D = x2 + 2

Solution:
Only y = x3 + 2 is satisfied by all the ordered pairs.
(i) –6 = (–2)3 + 2
(ii)   2 = 03 + 2
(iii)  3 = 13 + 2
Answer = B

13.1 Graphs of Functions


13.1 Graphs of Functions
 
13.1.1 Functions
1.   Function is a relationship that expresses a variable (dependent) in terms of another variable (independent).


2.   is a function of x if and only if every value of x corresponds to only one value of y.


13.1.2  Graphs of Functions
1.   A graph of function is a representation of the function as one or more lines on a coordinate plane.
Example:

2.  
When drawing graphs of functions, it is best to observe these few points:
· choose suitable scales for both axes.
· use at least three points to draw a straight line to ensure accuracy.
· use at least five points to draw a curve to ensure accuracy.

12.2.2 Linear Inequalities, PT3 Focus Practice


Question 6:
List all the integer values of x which satisfy the following linear inequalities:
–2 < 3x + 1 ≤ 10

Solution:
–2 < 3x + 1
–3 < 3x
x > –1
x = 0, 1, 2, 3, …

3x + 1 ≤ 10
3x ≤ 9
x ≤ 3
x = 3, 2, 1, 0, …

Therefore x = 0, 1, 2, 3


Question 7:
List all the integer values of x which satisfy the following linear inequalities:
–5 < 2x – 3 ≤ 1

Solution:
–5 < 2x – 3
–5 + 3 < 2x
2x > –2
x > –1
x = 0, 1, 2, 3, …  

2x – 3 ≤ 1
2x ≤ 4
x ≤ 2
x = 2, 1, 0, –1, …

Therefore x = 0, 1, 2


Question 8:
Given that 3< x2 <4 and x is an integer. List all the possible values of x.

Solution:

3< x2 <4 3 2 <x2< 4 2 9<x2 x>11   or   x2<16 x<18 11<x<18 x=12, 13, 14, 15, 16, 17


Question 9:
Find the biggest and the smallest integer of x that satisfy
3x + 2 ≥ –4 and 4 – x > 0.

Solution:
3x + 2 ≥ –4
3x ≥ –4 – 2
3x ≥ –6
x ≥ –2

4 – x > 0
x > –4
x < 4

Smallest integer of x is –2, and the biggest integer of x is 3.


Question 10:
If xhy satisfy the two inequalities 7 h 2 5 and  3( h+2 )20+h, find the values of x and y.

Solution:

7 h 2 5 h 2 57 h4 h4 3( h+2 )20+h 3h+620+h 2h14 h7 4h7 x=4,y=7

12.2.1 Linear Inequalities, PT3 Focus Practice


12.2.1 Linear Inequalities, PT3 Focus Practice

Question 1:
Draw a number line to represent the solution for the linear inequalities –3 < 5 – x  ≤ 4.
 
Solution:
–3 < 5 – x   and   5 – x  ≤ 4
x < 5 + 3   and   x  ≤ 4 – 5
x < 8   and   x ≤ –1 → x  ≥ 1

Thus, the solution is 1 ≤ x < 8

Question 2:
Solve the following simultaneous linear inequalities.
3x51    and    2 1 3 x<3

Solution:
3x – 5 ≤ 1
3x  ≤ 1 + 5
3x  ≤ 6
x  ≤ 2

2 1 3 x<3 6x<9   Multiply by 3   x<96 x<3 x>3   Multiply by 1  
The solution is –3 < x  ≤ 2.


Question 3:
The solution for the inequality 2 + < 3x – 4 is
  
Solution:
2 + x < 3x – 4  
x – 3x < –4 – 2
–2x < –6
x < –3
x > 3


Question 4:
The solution for the inequality –2 (6y + 3) < 3 (4 – 2y) is

Solution:
–2 (6y + 3) < 3 (4 – 2y)
–12y – 6 < 12 – 6y
–12y + 6< 12 + 6
–6y < 18
y < 3
y > –3 


Question 5:
Solve each of the following inequalities.
(a) 3x + 4 > 5x – 10
(b)   –3  ≤ 2x + 1 < 7

Solution:
(a)
3x + 4 > 5x – 10
3x – 5x > –10 – 4
–2x > –14
x > –7
x < 7

(b)
–3 ≤ 2x + 1 < 7
–3 ≤ 2x + 1   and   2x + 1 < 7
–2x  ≤ 1 + 3   and   2x < 7 – 1
–2x  ≤ 4 and   2x < 6
≥ –2   and   x < 3

The solution is –2 ≤ x < 3.