Question 7:
 Given that A, B and C are points such that OA = AB and ∠OAC = 90°, find
Solution:
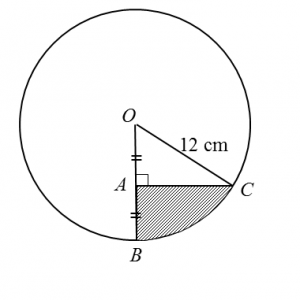
Diagram below shows a circle with centre O and radius 12 cm.
Given that A, B and C are points such that OA = AB and ∠OAC = 90°, find(a) ∠BOC, in radians,
(b) the area, in cm2, of the shaded region.
(a) For triangle OAC,
cos ∠AOC = 6/12
ÐAOC = 1.047 rad (change calculator to Rad mode)
ÐBOC = 1.047 rad
(b)
Area of the shaded region
= Area of BOC – Area of triangle AOC
= ½ (12)2 (1.047) – ½ (6) (12) sin 1.047 (change calculator to Rad mode)
= 75.38 – 31.17
= 44.21 cm2
Question 8:
Solution:
Diagram below shows a sector QOR of a circle with centre O.
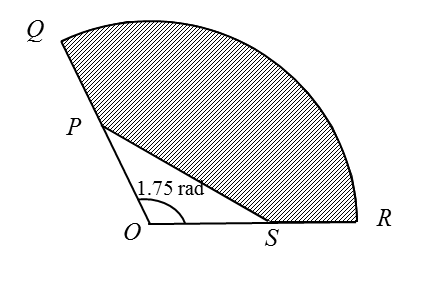
It is given that PS = 8 cm and QP = PO= OS = SR = 5 cm.
Find
(a) the length, in cm, of the arc QR,
(b) the area, in cm2, of the shaded region.
(a) Length of arc QR = r θ = 10 (1.75) = 17.5 cm
(b)
Area of the shaded region
= Area of sector QOR – Area of triangle POS
= ½ (10)2 (1.75) – ½ (5) (5) sin 1.75 (change calculator to Rad mode)
= 87.5 – 12.30
= 75.2 cm2

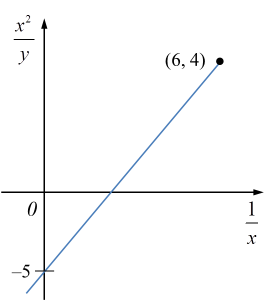 Diagram 11
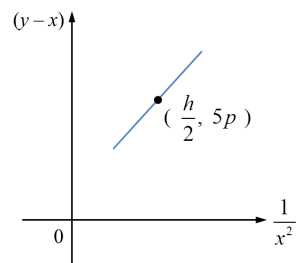 Diagram 12