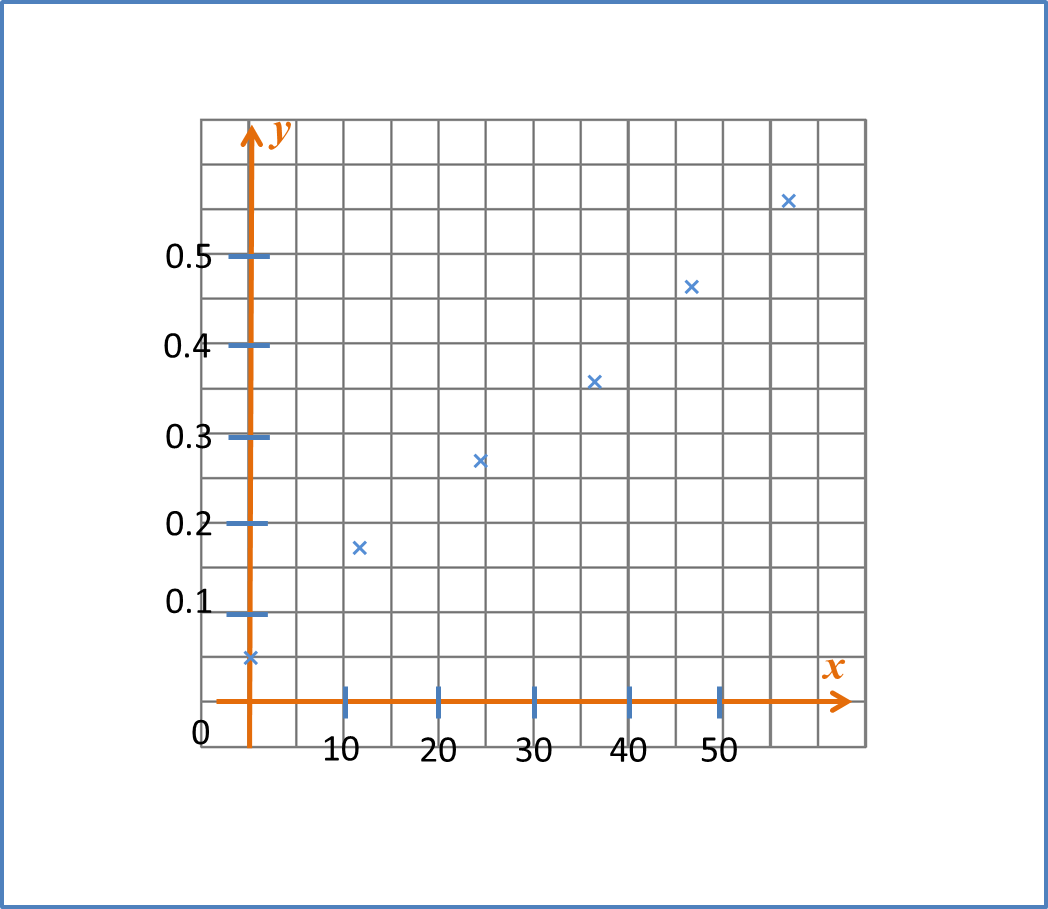
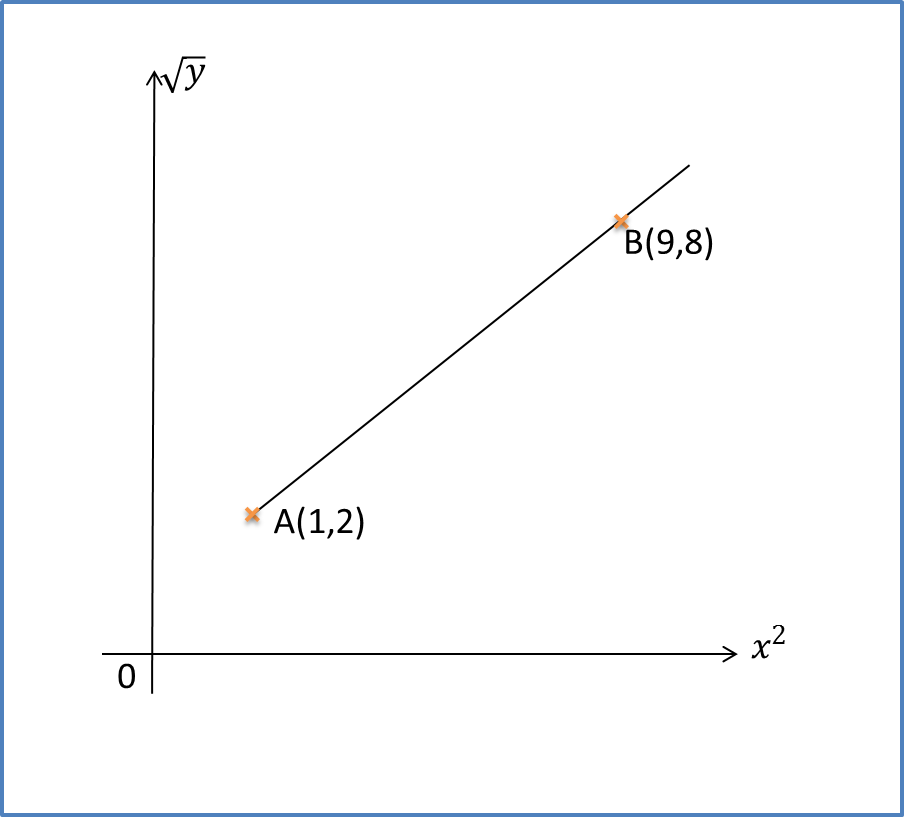
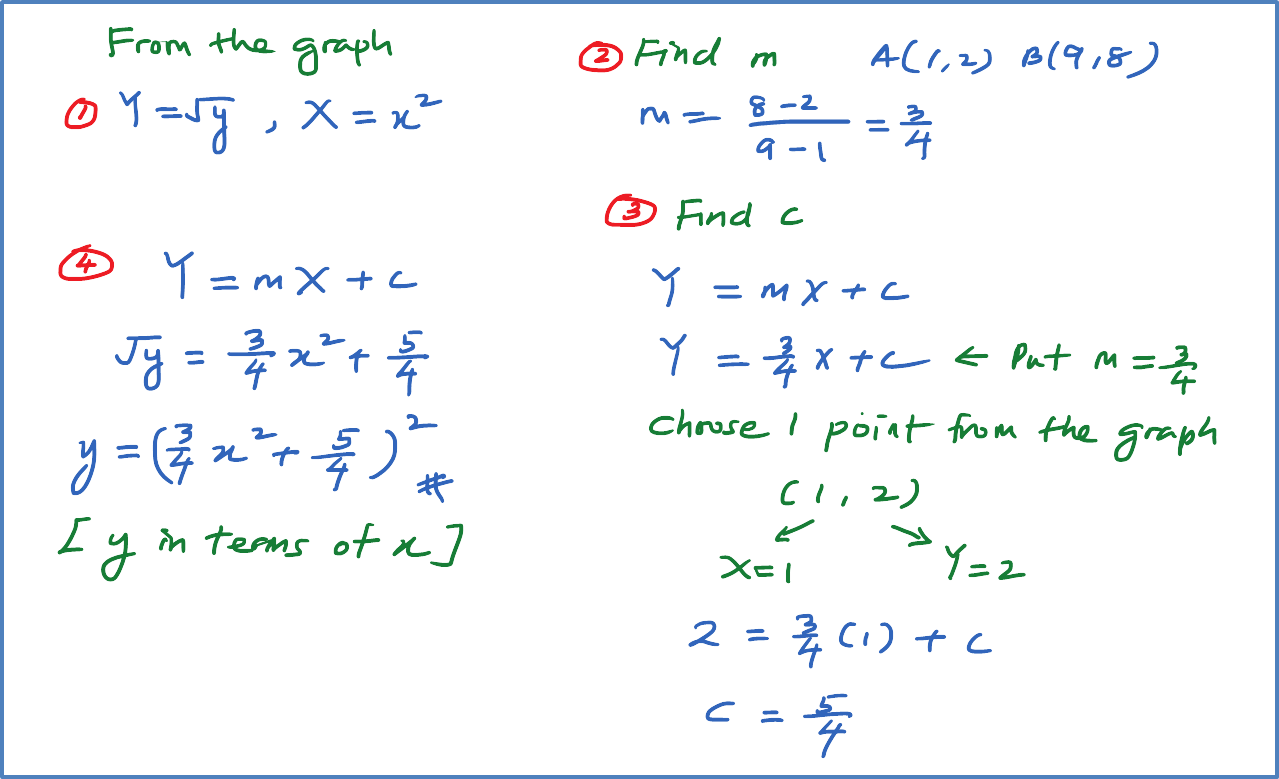
Examples:
Reduce each of the following equations to the linear form. Hence, state the gradient and the Y-intercept of the linear equations in terms of a and b.
Reduce each of the following equations to the linear form. Hence, state the gradient and the Y-intercept of the linear equations in terms of a and b.
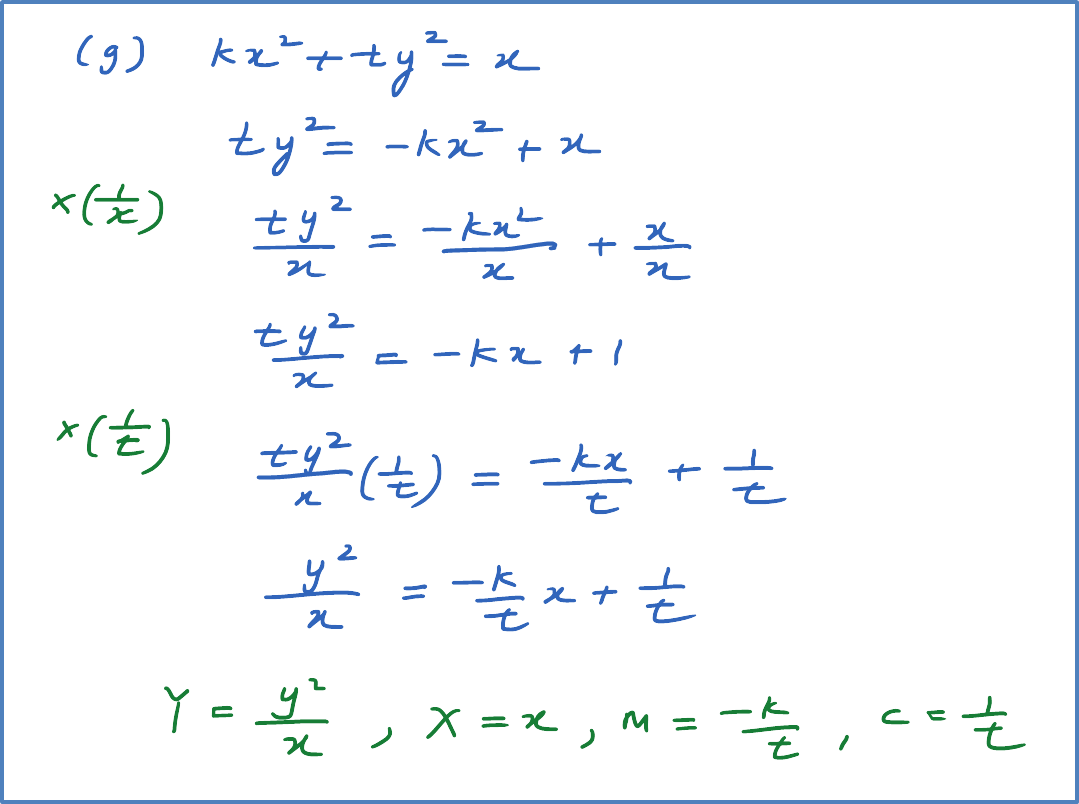
(g)
kx2+ty2=x
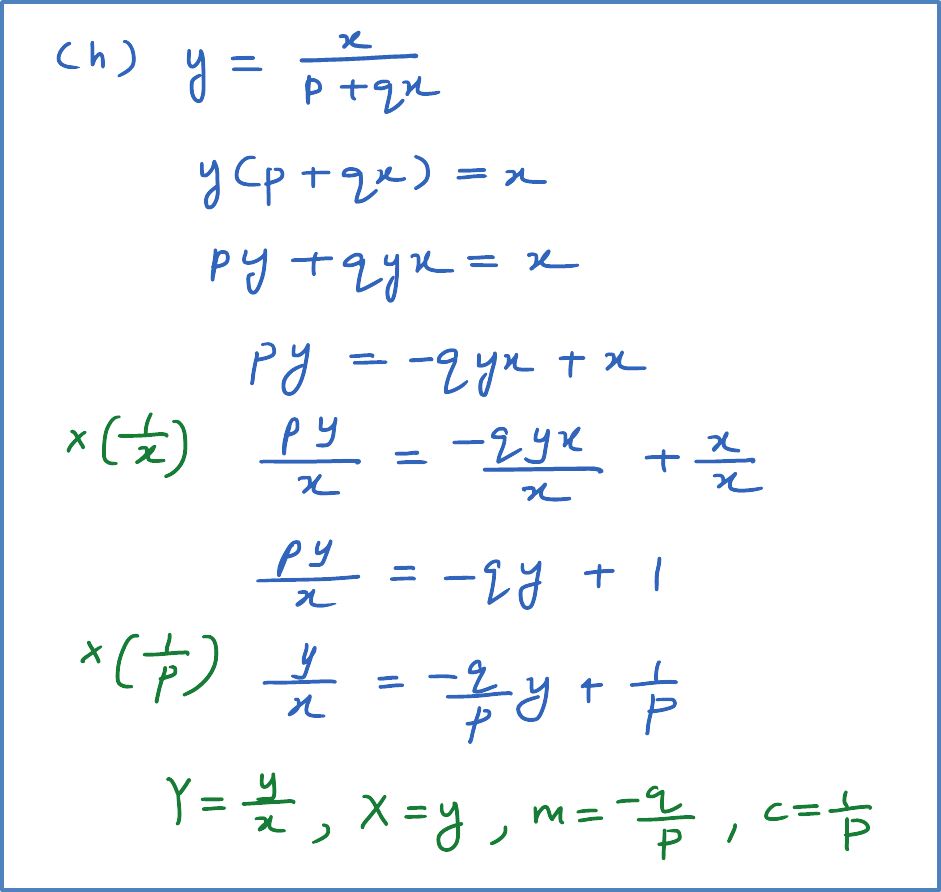
(h)
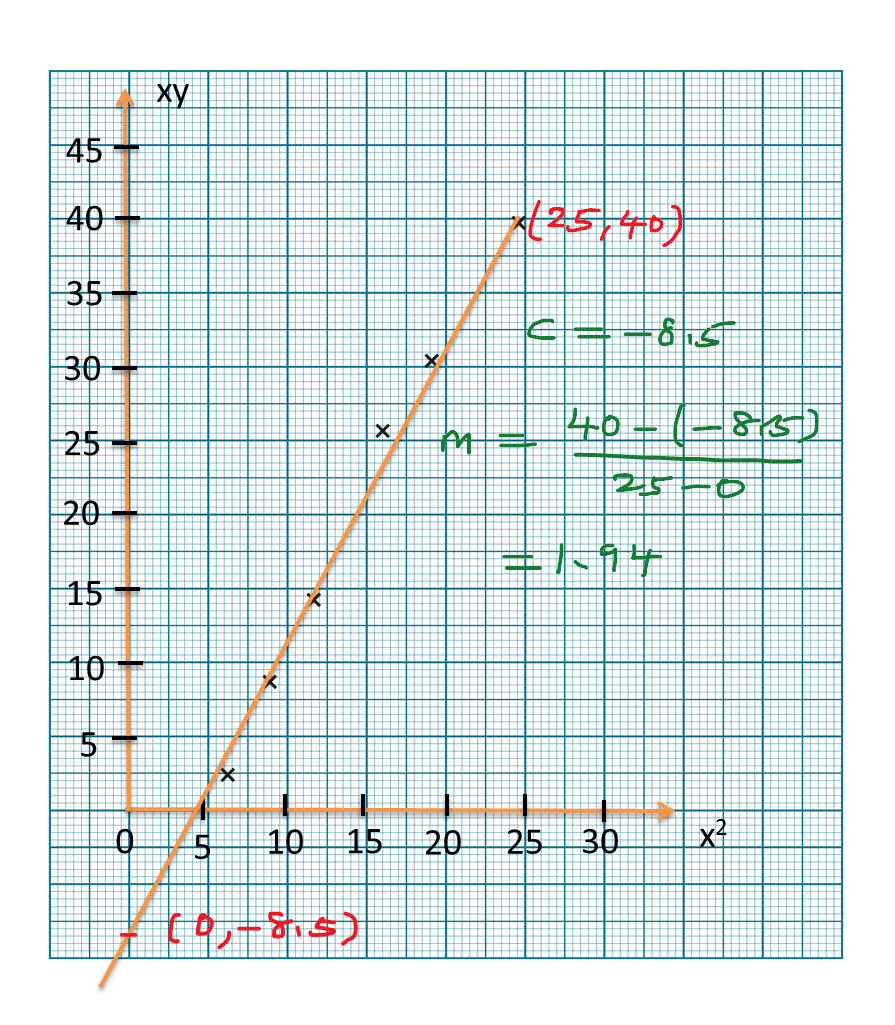
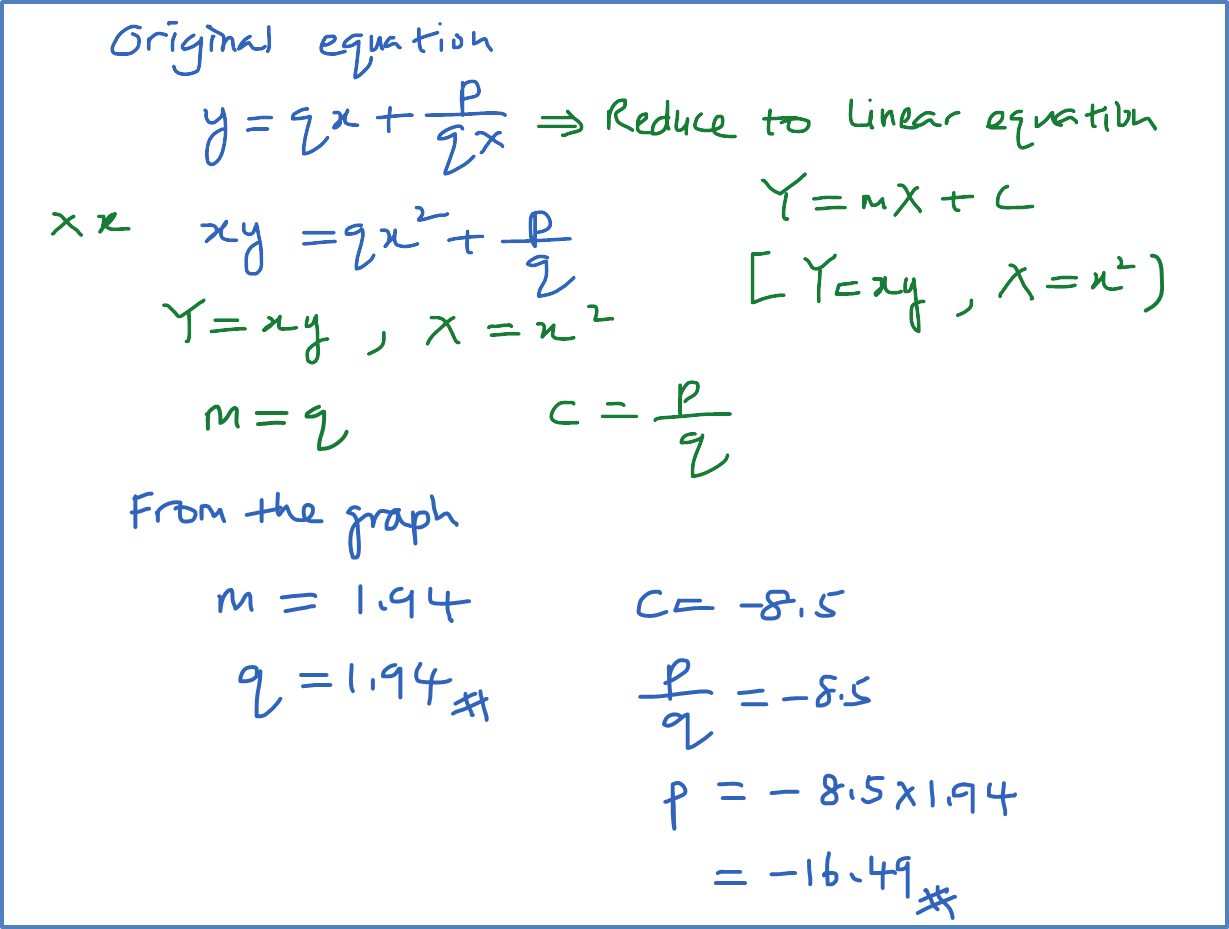
y=xp+qx
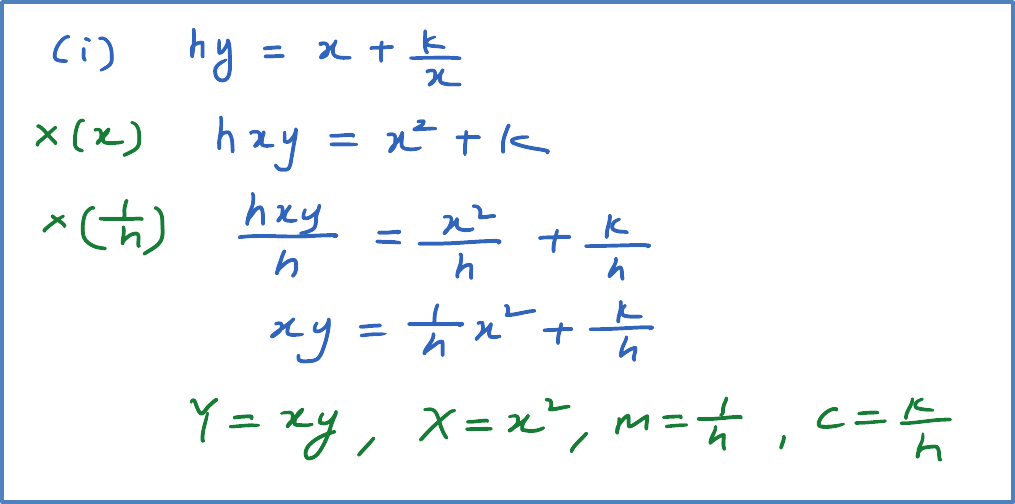
(i)
hy=x+kx
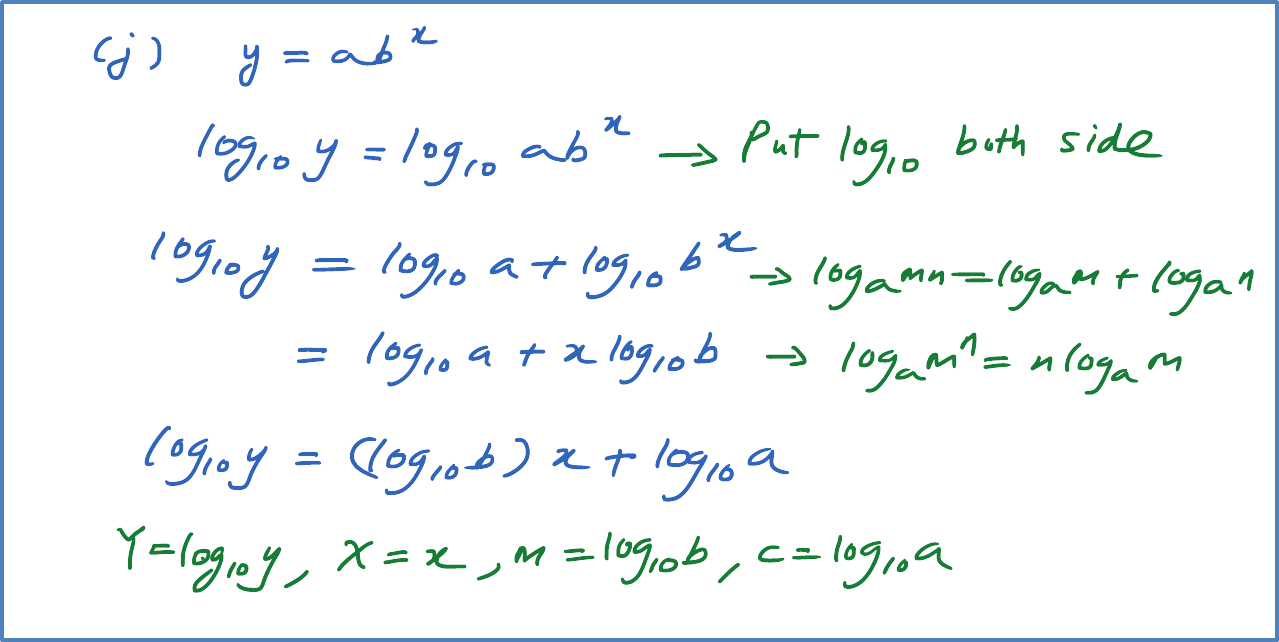
(j)
y=abx
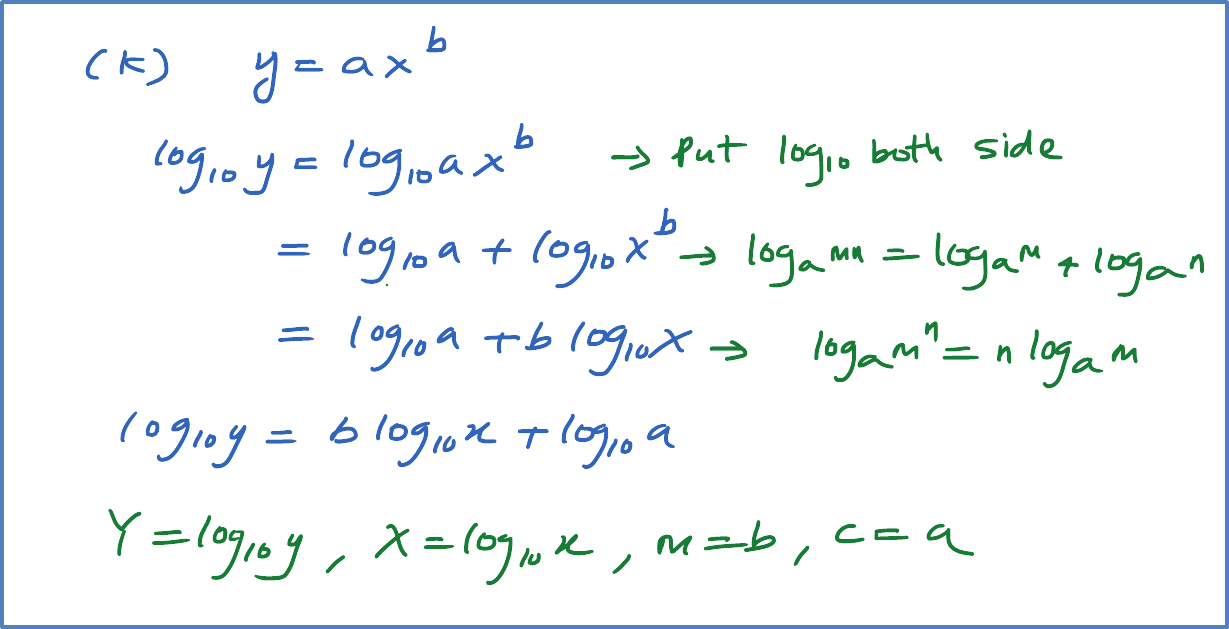
(k)
y=axb
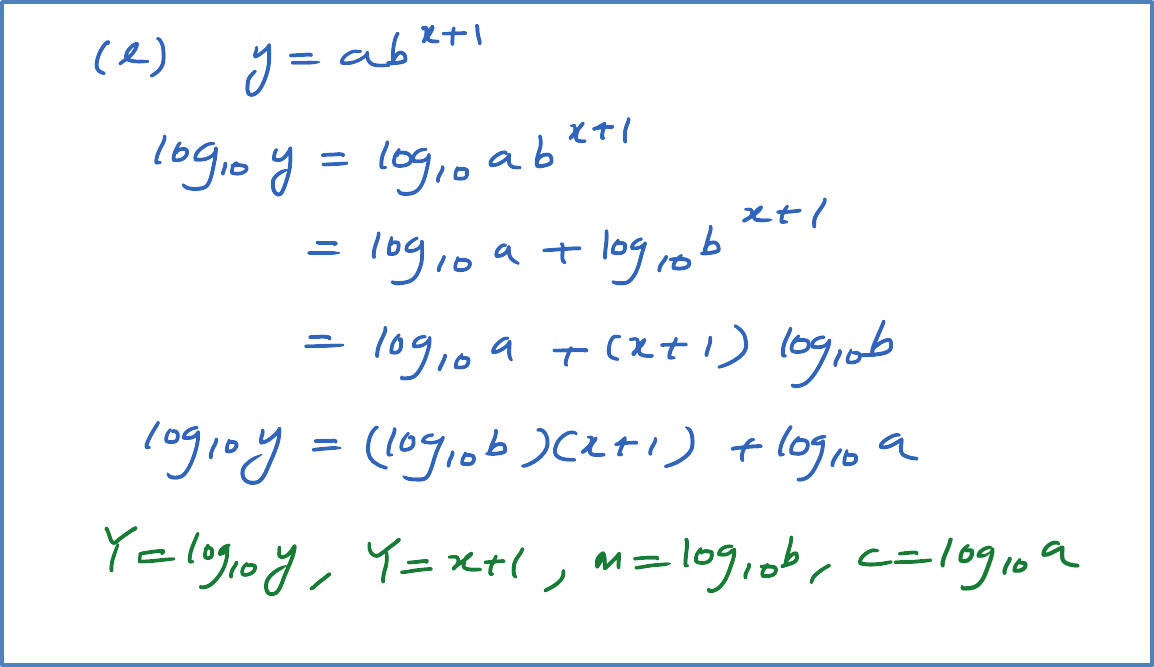
(l)
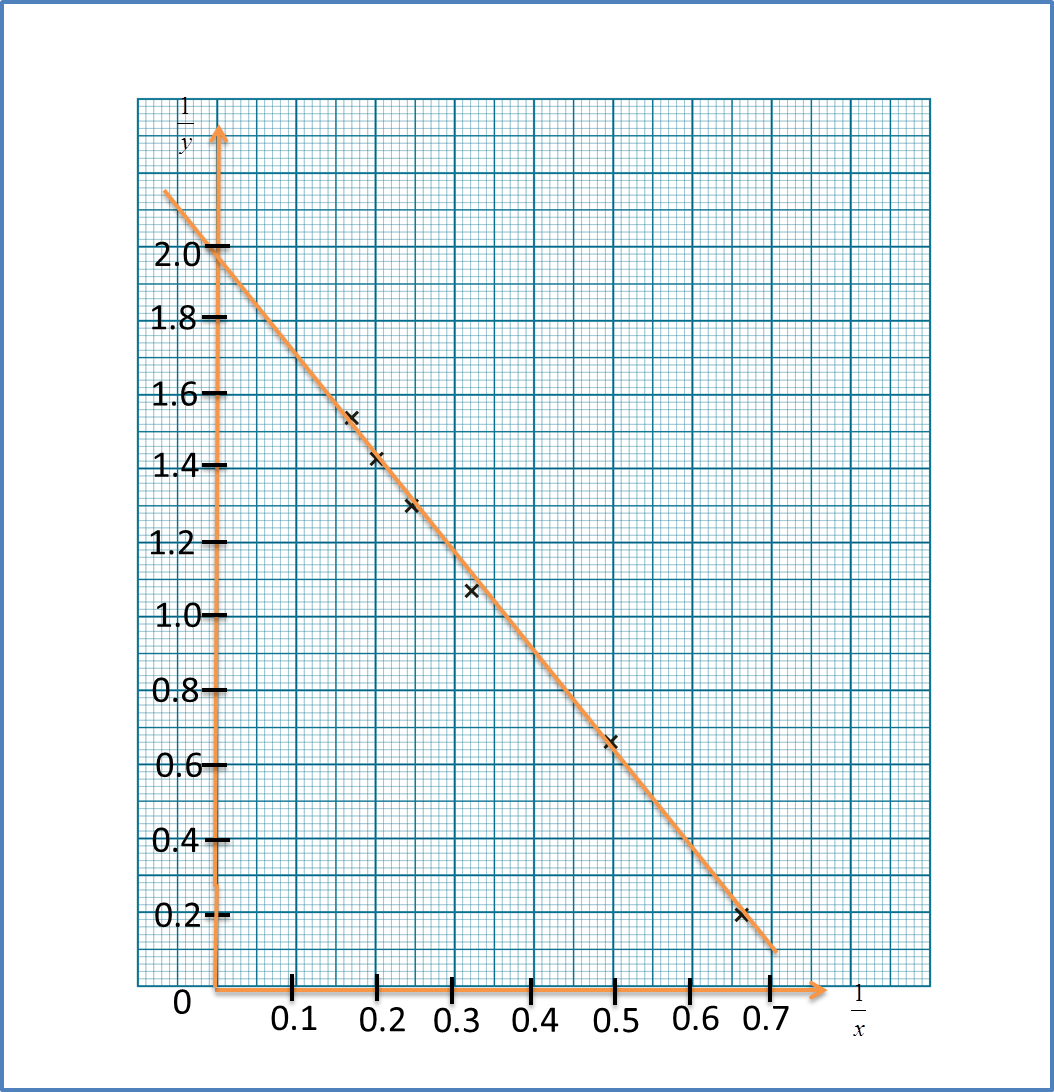
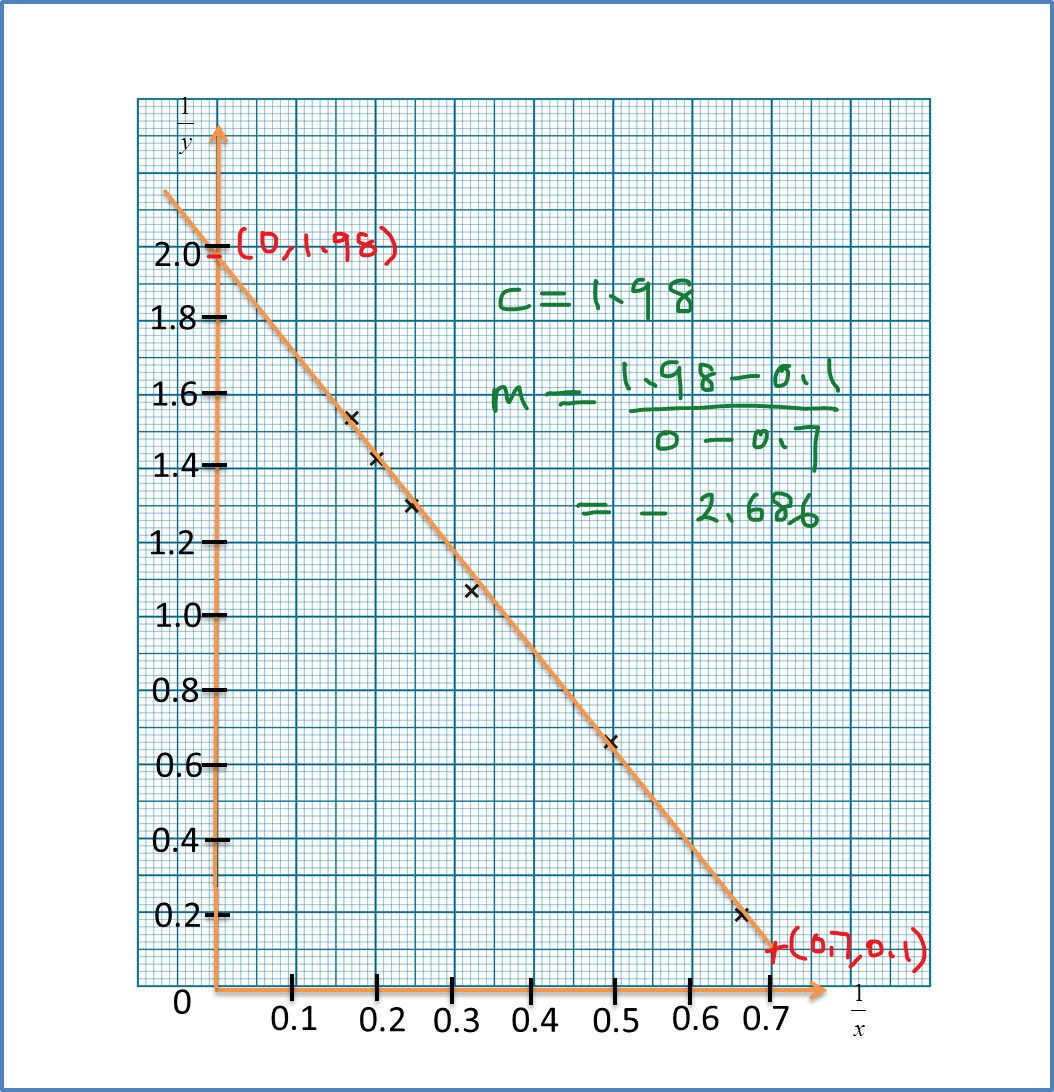
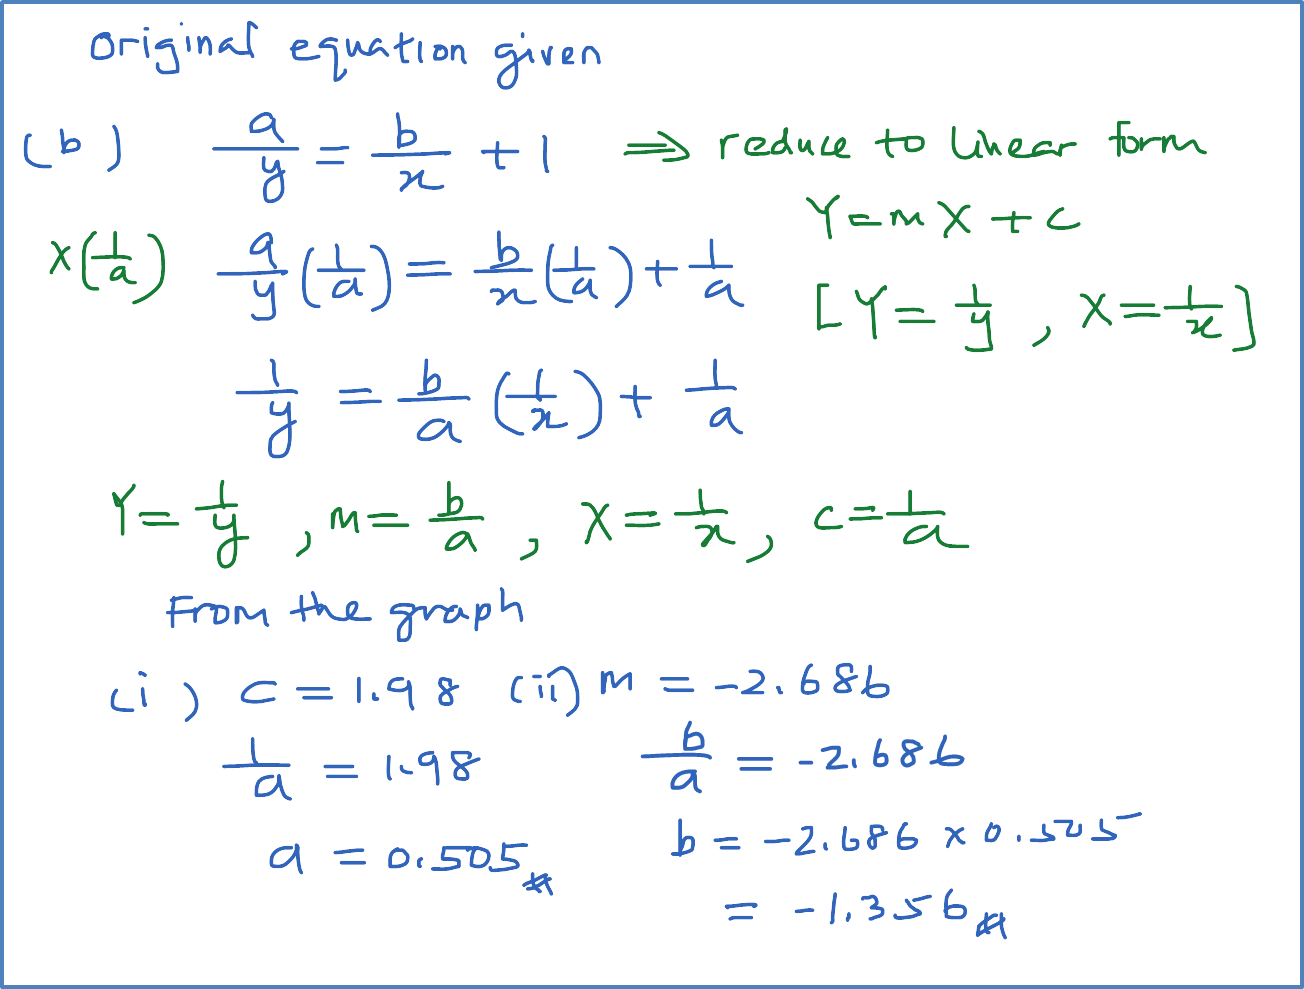
y=abx+1
[Note :
X and Y cannot have constant, but can have the variables (for example x and y)
m and c can only have the constant (for example a and b), cannot have the variables x and y]
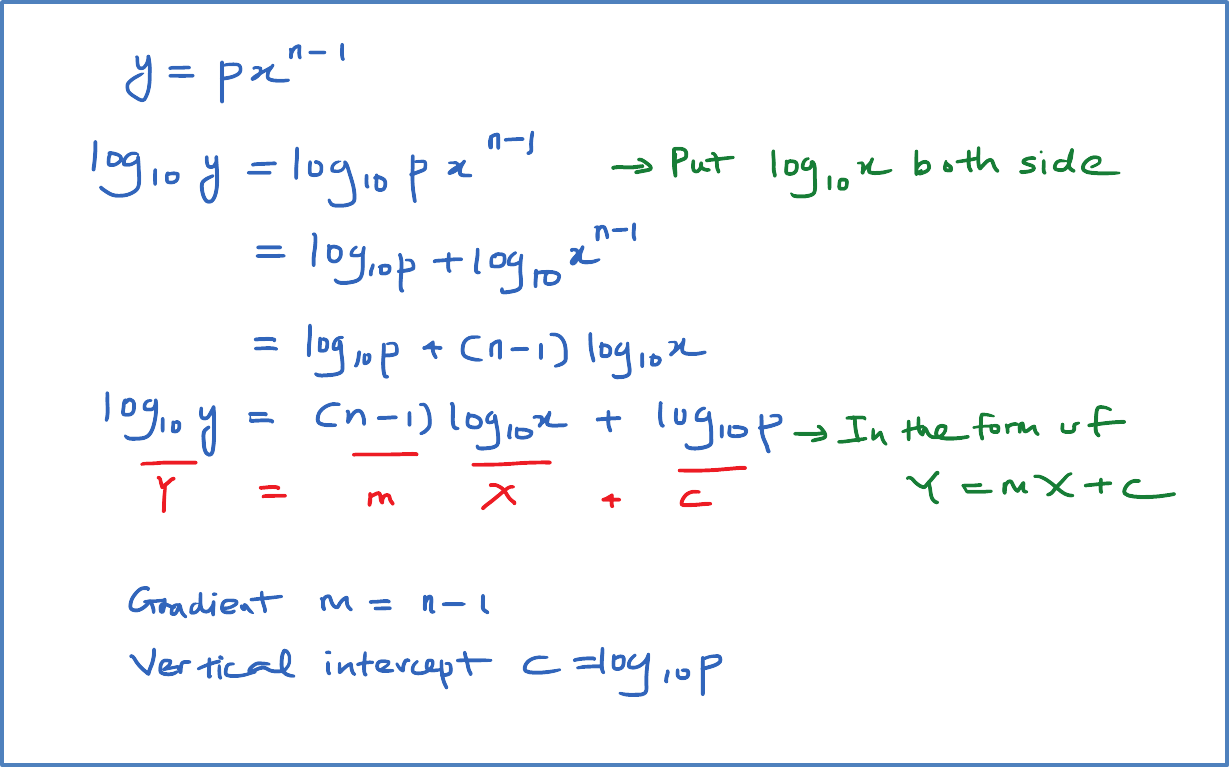
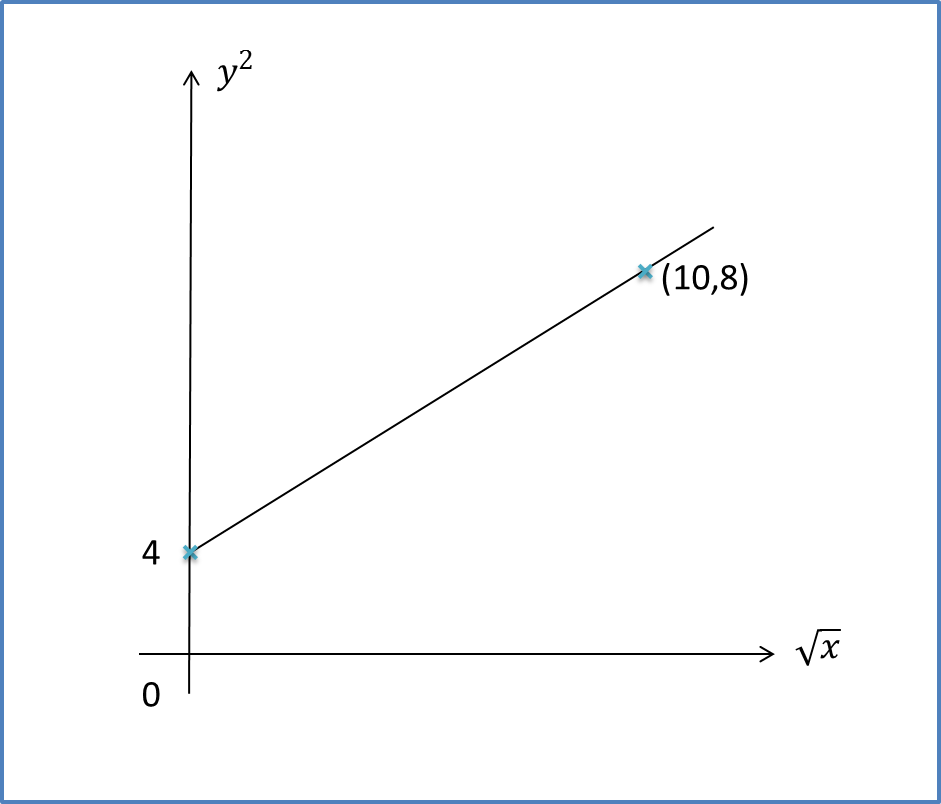
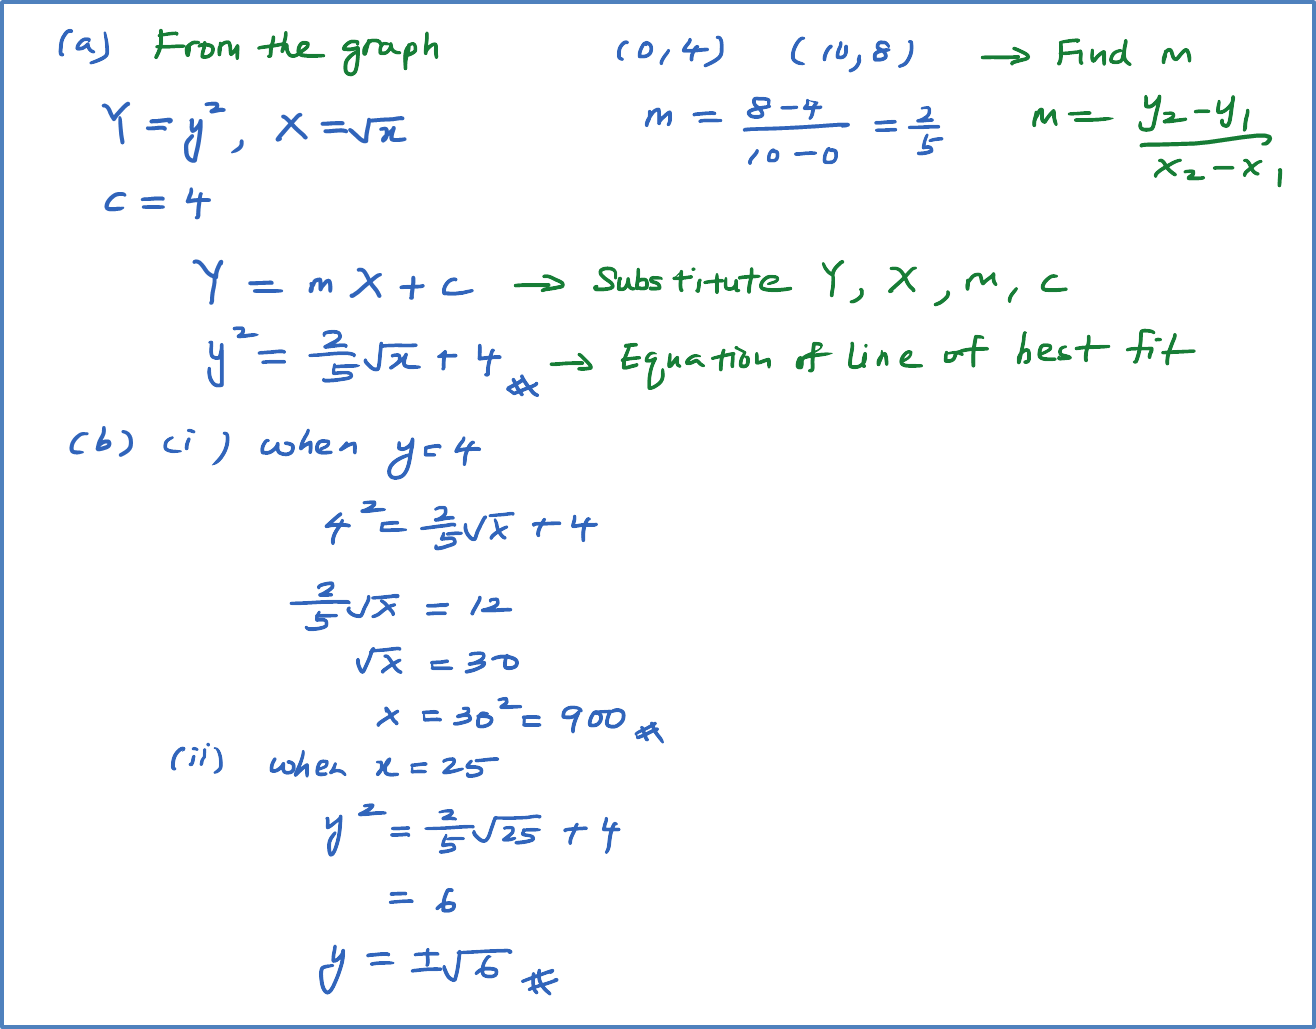
Solution: