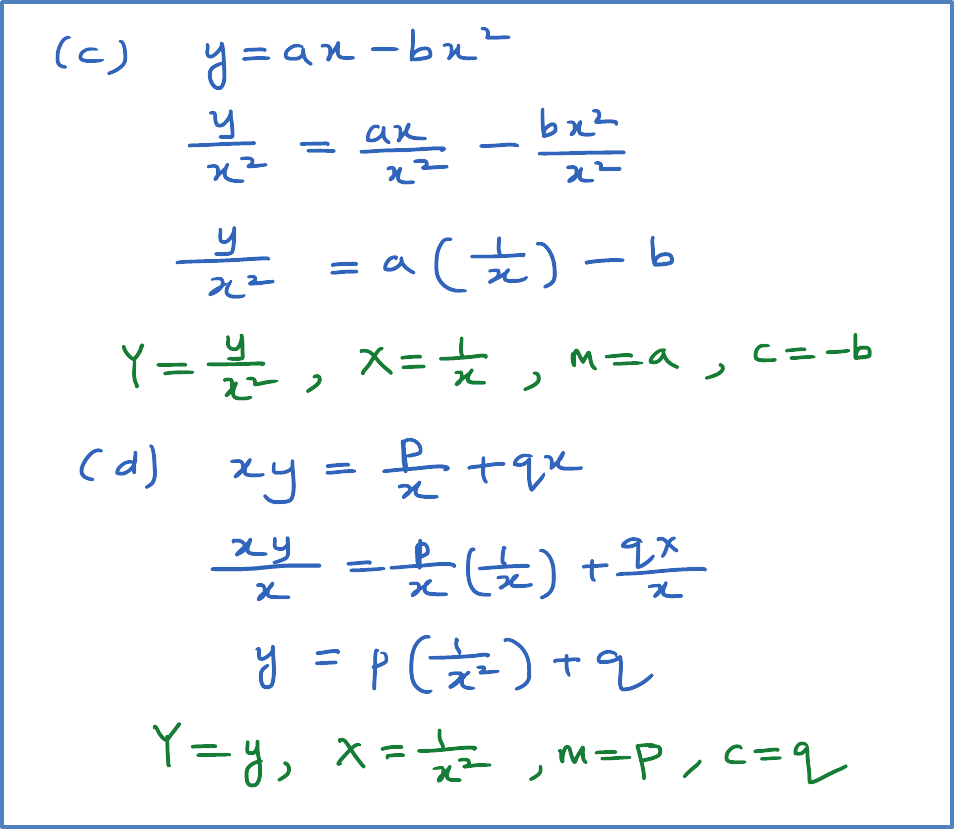
(A) Equation of a straight Line
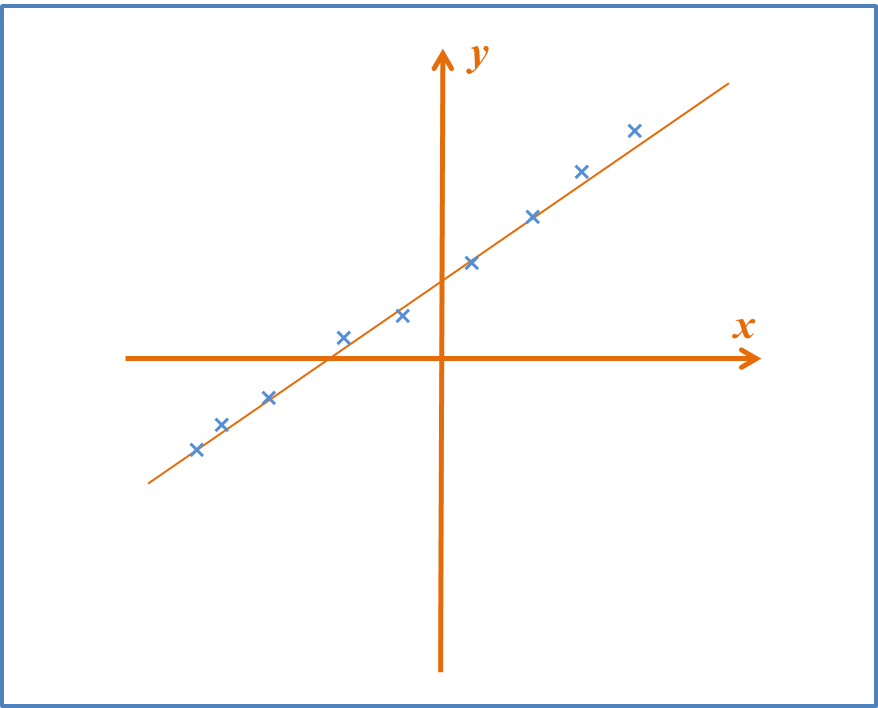
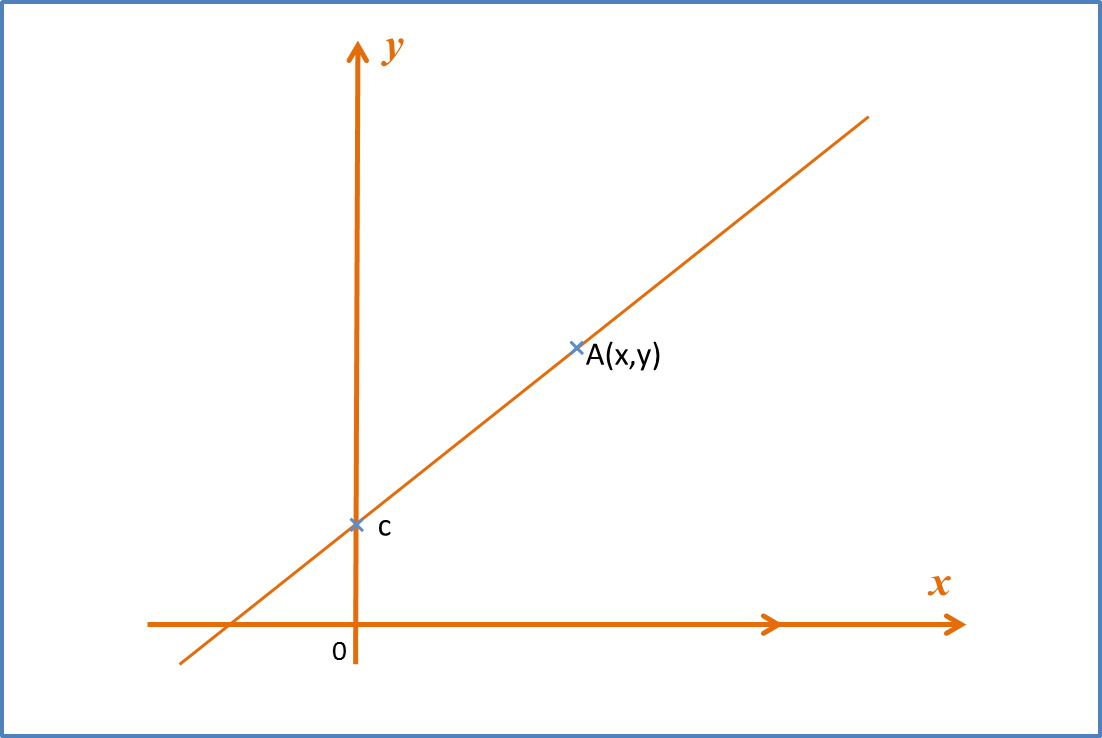
An equation of straight line is given by y = mx + c.
• The variables x and y are linearly related
• The term c is known as y-intercept. It represents the y value where the line cuts the y-axis
• The term m is the gradient of the straight line and its value is constant
An equation of straight line is given by y = mx + c.
• The variables x and y are linearly related
• The term c is known as y-intercept. It represents the y value where the line cuts the y-axis
• The term m is the gradient of the straight line and its value is constant
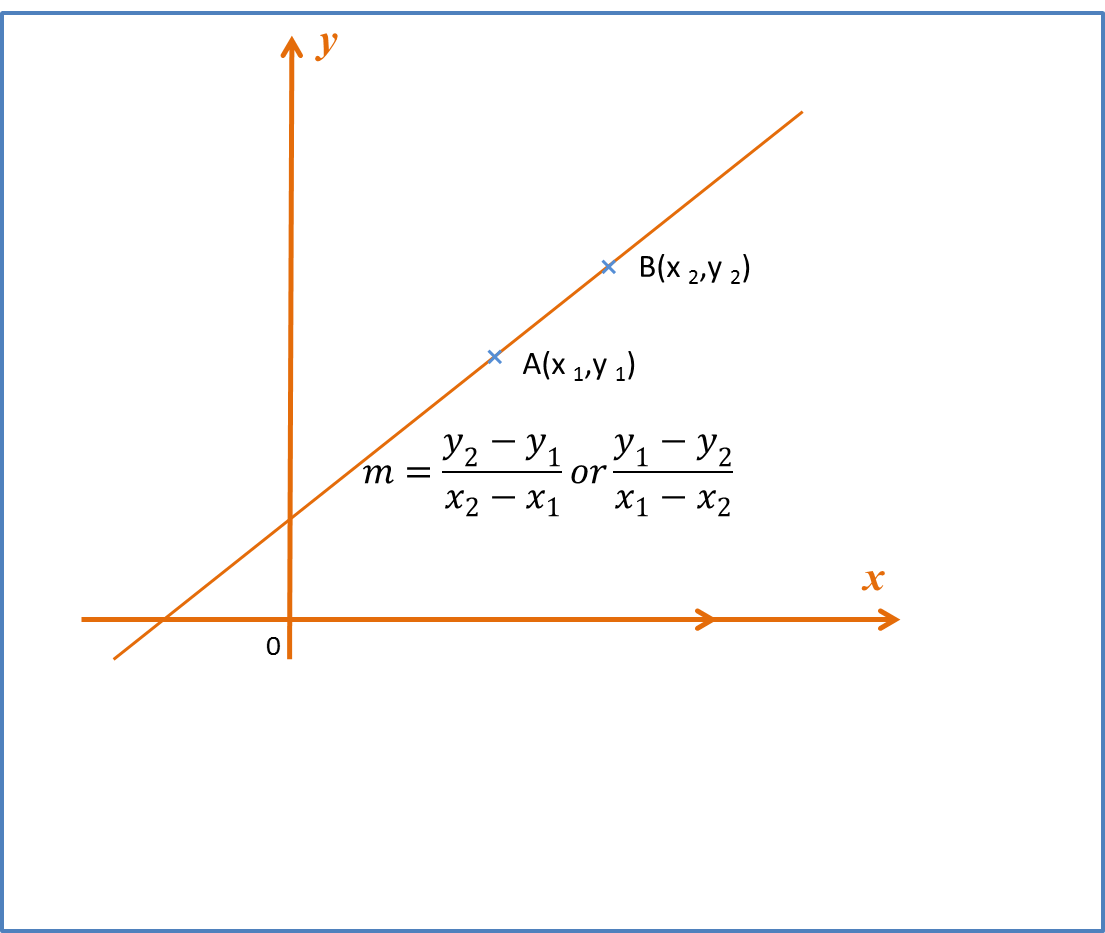
(B) Gradient of a Straight Line
If the points A(x1,y1) and B(x2,y2) lie on the straight line y=mx+c , then gradient of ,the straight line
m=y2−y1x2−x1ory1−y2x1−x2
If the points A(x1,y1) and B(x2,y2) lie on the straight line y=mx+c , then gradient of ,the straight line
m=y2−y1x2−x1ory1−y2x1−x2
(C) Mid Point
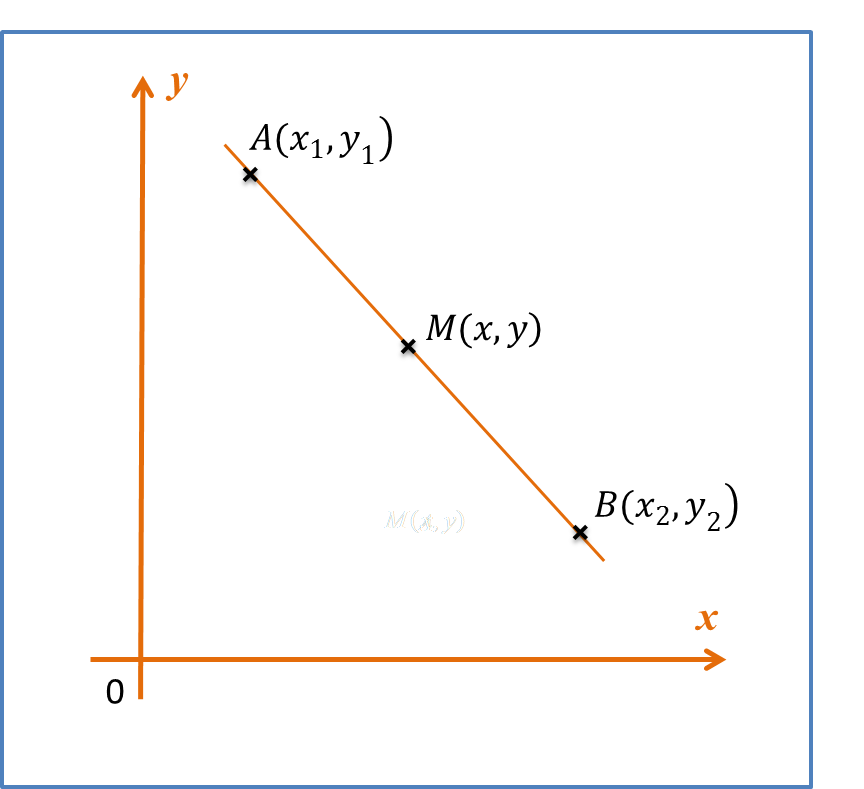
Mid Point AB is given by M=(x1+x22 , y1+y22)
Mid Point AB is given by M=(x1+x22 , y1+y22)
(D) Distance Between Two Points
Distance between point A(x1,y1) and point is B(x2,y2) given by √(x1−x2)2+(y1−y2)2
Distance between point A(x1,y1) and point is B(x2,y2) given by √(x1−x2)2+(y1−y2)2