2.2 Solving Equations Graphically


2.2 Solving equations graphically
 
The solution of the equation f (x) = g (x) can be solved by graphical method.

Step 1
: Draw the graphs of y = f (x) and y = g (x) on the same axes.
Step 2: The points of intersection of the graphs are the solutions of the equation f (x) = g(x). Read the values of x from the graph. 


Solution of an Equation by Graphical Method

Example 1:
(a) The following table shows the corresponding values of x and y for the equation = 2x2 x – 3.
 
x
–2
–1
–0.5
1
2
3
4
4.5
5
y
7
m
– 2
–2
3
12
n
33
42
Calculate the value of m and n.
 
(b) For this part of the question, use graph paper. You may use a flexible curve rule.
By using a scale of 2 cm to 1 unit on the x-axis and 2 cm to 5 units on the y-axis, draw the graph of  y = 2x2 x – 3 for –2 ≤ x ≤ 5.

(c)
From your graph, find
(iThe value of when x = 3.9,
(iiThe value of when y = 31.
 
(d) Draw a suitable straight line on your graph to find the values of x which satisfy the equation 2x 3x = 10 for –2 ≤ x ≤ 5.

Solution:
(a)
= 2x2 x – 3
when x = –1,
= 2 (–1)2 – (–1) – 3 = 0
when x = 4,
= 2 (4)2 – (4) – 3 = 25

(b)


(c)
(i) From the graph, when x = 3.9, y = 23.5
(iiFrom the graph, when y = 31, x = 4.4

(d)
= 2x2 x – 3 ----- (1)
2x 3x = 10 ----- (2)
= 2x2 x – 3 ----- (1)
0 = 2x2 3x – 10 ------ (2) ← (Rearrange (2))
(1)  – (2) : y = 2x + 7
The suitable straight line is y = 2x + 7.
 
Determine the x-coordinates of the two points of intersection of the curve 
y = 2x2 x – 3 and the straight line y = 2x+ 7.
 
x
0
4
y = 2x + 7
7
15
From the graph, = –1.6, 3.1


2.4 SPM Practice (Short Questions)


2.4.2 SPM Practice (Short Questions)
 
Question 3:
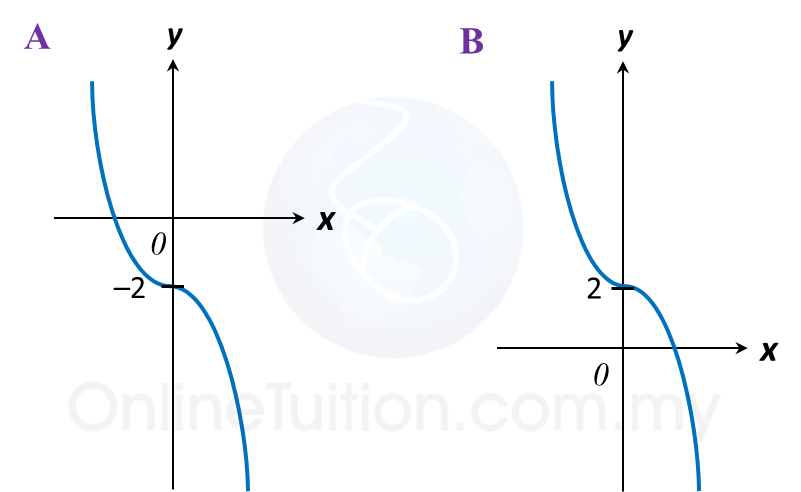
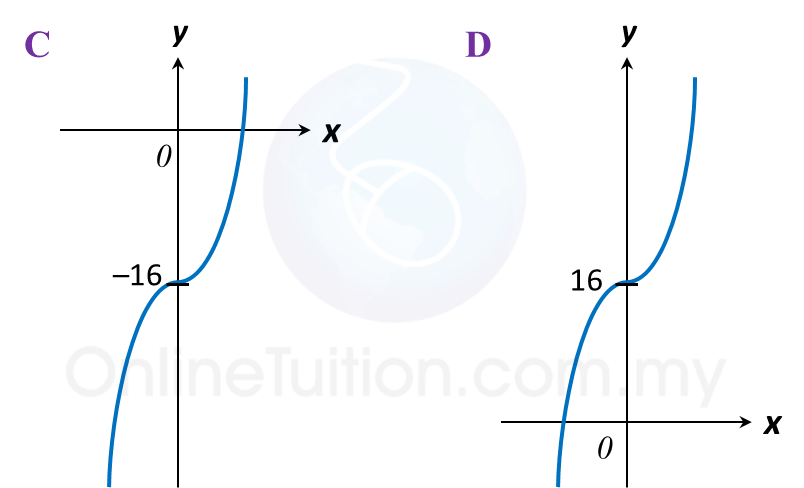
Which of the following graphs represent y = 2x– 16?


Solution:
y = 2x3 – 16
On the y-axis, x = 0.
y = 2(0)3 – 16
y = –16
 
The answer is C.


Question 4:
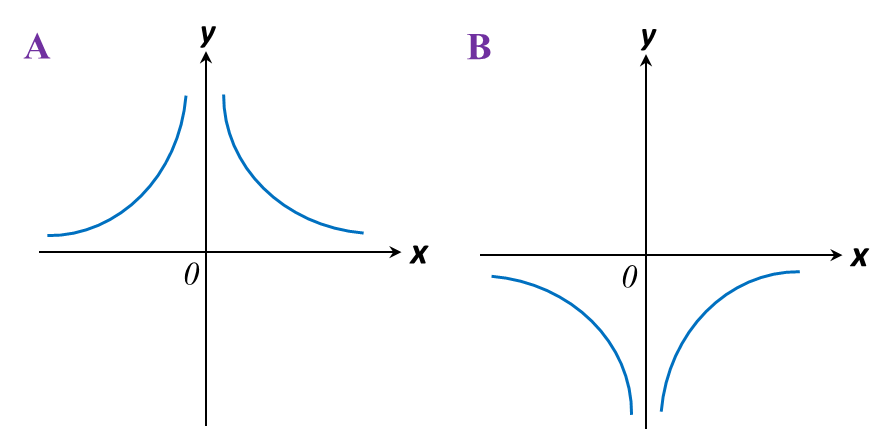
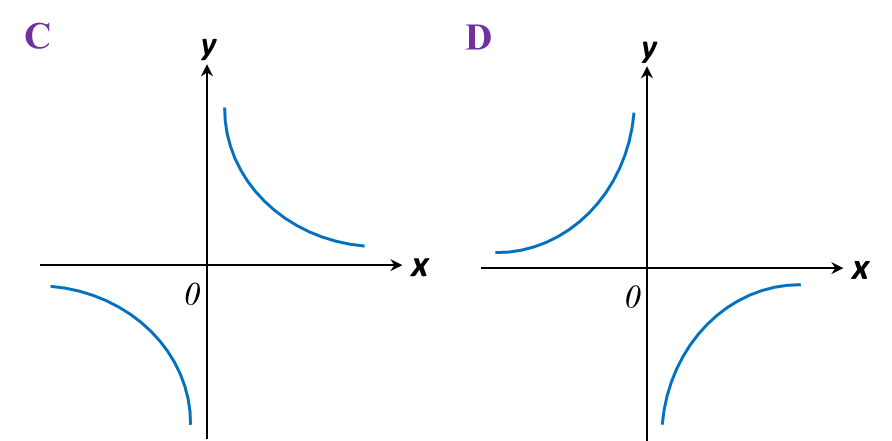
Which of the following graphs represent y = 3 x ?


Solution:
y= 3 x  or y=3 x 1
Highest power of the variable x is –1.
It is a reciprocal function y= a x , in this case a=3.
The answer is D.

2.5 SPM Practice (Long Questions)


Question 5:
(a) The following table shows the corresponding values of x and y for the equation y = 24 x
  
x
–4
–3
–2
–1
1
1.5
2
3
4
y
–6
k
–12
–24
24
n
12
8
6
Calculate the value of k and n.
 
(b) For this part of the question, use graph paper. You may use a flexible curve rule.
By using a scale of 2 cm to 1 unit on the x-axis and 2 cm to 5 units on the y-axis, draw the graph of  y = 24 x  for –4 ≤ x ≤ 4.
 
(c) From your graph, find
(i) The value of when x = 3.5,
(ii) The value of when y = –17.
 
(d) Draw a suitable straight line on your graph to find the value of x which satisfy the equation 2x2 + 5= 24 for –4 ≤ x ≤ 4.
 
Solution:
(a)
y= 24 x when x=3, k= 24 3 =8 when x=1.5, n= 24 1.5 =16

(b)


(c)
(i) From the graph, when x = 3.5, y = 7
(ii) From the graph, when y = –17, x = –1.4

(d)
 

y = 24 x -------------- (1) 2 x 2 + 5 x = 24 ------ (2) ( 2 ) ÷ x , 2 x + 5 = 24 x -------- (3) ( 1 ) ( 3 ) , y ( 2 x + 5 ) = 0 y = 2 x + 5

The suitable straight line is y = 2x + 5.
Determine the x-coordinate of the point of intersection of the curve and the straight line = 2x + 5.
 
x
0
3
y = 2x + 5
5
11
From the graph, = 2.5

2.4 SPM Practice (Short Questions)


2.4 SPM Practice (Short Questions)
 
Question 1:
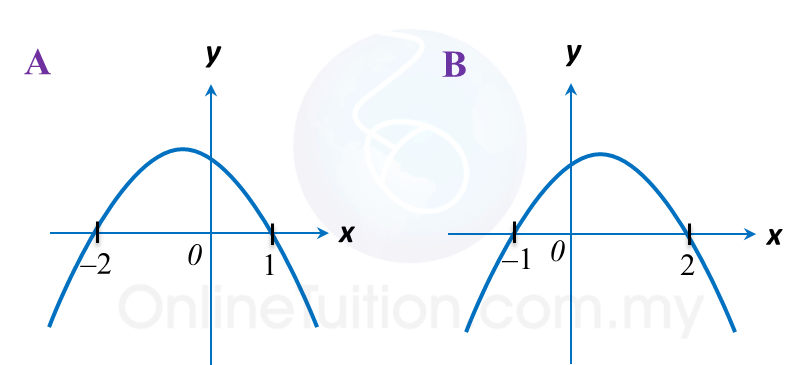
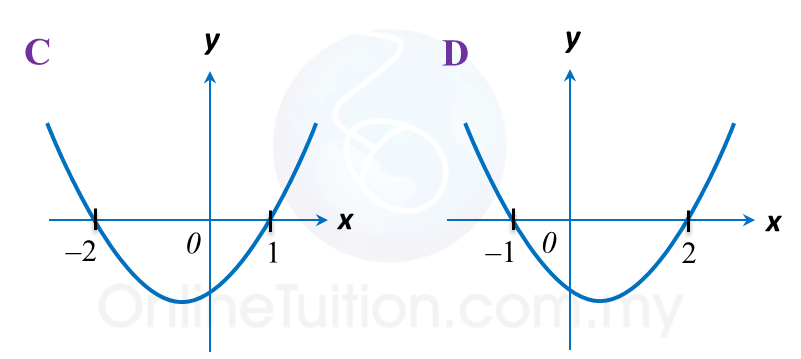
Which of the following graphs represent y = –x– x + 2?


Solution:
1.   The coefficient of x2 < 0, its shape is ∩.
2.   Find the x-intercepts by substituting y = 0 into the function.
y = –x2x + 2
when y = 0
0 = (–x + 1) (x + 2)
x = 1, –2
 
The answer is A.


Question 2:
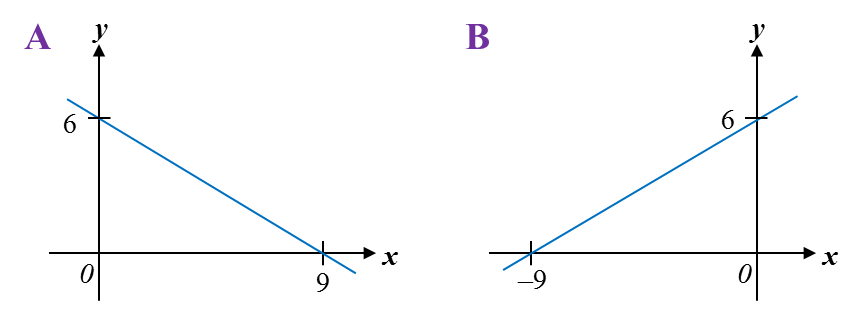
Which of the following graphs represent 3y = 18 + 2x?


Solution:
1.   The highest power of x = 1, it is a linear graph, i.e. a straight line.
2.   The coefficient of x > 0, the straight line is /.
 
3y = 18 + 2x
On the y-axis, x = 0.
3y = 18
y = 6
 
On the x-axis, y = 0.
0 = 18 + 2x
2x = –18
x = –9
 
The answer is B.
 

2.1 Graphs of Functions (Part 1)


2.1 Graphs of Functions
 
(A) Drawing graphs of functions
 
1. To draw the graph of a given function, the following steps are taken.

Step 1
: Construct a table of values for the given function.
Step 2: Select a suitable scale for the x-axis and y-axis, if it is not given.
Step 3: Plot the points and complete the graph by joining the points.
Step 4: Label the graph.


2.3 Region Representing inequalities in Two Variables (Part 1)

2.3.1 Position of a point relative to the graph of y = ax+ b
1. When = ax + b, the point is on the line.
2. When < ax + b, the point is below the line.
3. When > ax + b, the point is above the line. 


2.3.2 Identifying the region satisfying the respective inequalities.

1.   A dashed line ‘----’ is used when points on the line are not included in the region representing the inequality, such as y > ax + b or y < a or x > a.

2.   A solid line ‘___’ is used when points on the line are not included in the region representing the inequality, such as yax + b or y ≤  a or xa.

3.   The diagrams below show the regions that satisfy the respective inequalities.


2.3.3 Region Representing inequalities in Two Variables (Sample Questions)


Example 1:
On the graph in the answer space, shade the region which satisfies the three inequalities ≥ –x + 10, y > x and y < 9.
 
Answer:


Solution:
1.  The region that satisfies the inequality ≥ –x + 10 is the region on and above the line y = –x + 10.

2.  The region that satisfies the inequality > x is the region above the line y = x. Since inequality sign “ >” is used, the points on the line = x is not included. Thus, a dashed line needs to be drawn for y = x.

3.  The region that satisfies the inequality < 9 is the region below the line y = 9 drawn as a dashed line.


Example 2:
On the graph in the answer space, shade the region which satisfies the three inequalities ≥ –2x + 10, y ≤ 10 and x < 5.
 
Answer:

 
Solution:
1. The region which satisfies the inequality of the form yax + c is the region that lies on and above the line y = ax+ c.

2. In this question, y intercept, c = 10, x intercept is 5.

3. The region that satisfies the inequality ≥ –2x + 10 is the region on and above the line y = –2x + 10.

4. The region that satisfies the inequality ≤ 10 is the region on and below the line y = 10.

5. The region that satisfies the inequality < 5 is on the left of the line x = 5 drawn as a dashed line.


1.2 SPM Practice (Short Questions)


Question 1:
Express 2058 as a number of base five.

Solution:

2058 = 2 × 82 + 0 × 81+ 5 × 80 = 13310


Question 2:
State the value of the digit 6 in the number 16238, in base ten.

Solution:

Identify the place value of each digit in the number first.
1
6
2
3
Place Value
83
82
81
80
Value of the digit 6
= 6 × 82
= 384


Question 3:
Given 3 × 53 + 4 × 52 + 5p = 34205, find the value of p.
 
Solution:
34205 = 3 × 53 + 4 × 52+ 2 × 51 + 0 × 50
34205 = 3 × 53 + 4 × 52+ 5p+ 0
5p = 2 × 51
5p = 10
p = 2


Question 4:
Convert 4 × 84 + 2 × 82 + 4 to a number in base eight.
 
Solution:
84
83
82
81
80
4
0
2
0
48
Answer = 402048

1.1   Number Bases (Part 1)

(A) Numbers in Bases Two, Eight and Five
1. The numbers we use daily are in base ten. The ten digits used in numbers in based ten are 0, 1, 2, 3, 4, 5, 6, 7, 8 and 9.

2. 
Numbers in base two are numbers that use two digits only. The digits are 0 
and 1. Example: 1011012.

3. 
Numbers in base eight are numbers that use eight digits only. The eight 
digits used in numbers in based ten are 0, 1, 2, 3, 4, 5, 6, and 7. 
Example: 6758.

4. 
Numbers in base five are numbers that use five digits only. The five digits 
used in numbers in based five are 0, 1, 2, 3, and 4. Example: 1345.


(B) Value of a Digit of a Number in Base 2, 8 and 5
1. The following tables show the place values of the digits of a number
 (a) In base 2
Place value
26 = 64
25 = 32
24 = 16
23 = 8
22 = 4
21 = 2
20 = 1

(b) In base 8
Place value
84 = 4096
83 = 512
82 = 64
81 = 8
80 = 1

(c) In base 5
Place value
54 = 625
53 = 125
52 = 25
51 = 5
50 = 1
2.
 Value of a digit = The digit × Place value of the digit

Example 1:
State the value of the underlined digit in each of the following numbers.
(a) 10111012   (b) 36518   (c) 32415

Solution:
 (a)

Place value
26 = 64
25 = 32
24 = 16
23 = 8
22 = 4
21 = 2
20 = 1
Number
1
0
1
1
1
0
1
= 1 × 26The value of the underlined digit 1
= 1 × 64
= 64

(b)


Place value
83 = 512
82 = 64
81 = 8
80 = 1
Number
3
6
5
1
= 6 × 82
The value of the underlined digit 6
= 6 × 64
= 384

(c)

Place value
53 = 125
52 = 25
51 = 5
50 = 1
Number
3
2
4
1
= 3 × 53
The value of the underlined digit 3
= 3 × 125
= 375


(C) Writing a Number in Base 2, 8, or 5 in Expanded Notation
1. A number written in expanded notation refers to the sum of the value of the digits that make up the number.

Example 2:
Write each of the following in expanded notation.
(a) 1110112  (b) 4758 (c) 24135

Solution:
(a)

Place value
25 = 32
24 = 16
23 = 8
22 = 4
21 = 2
20 = 1
Number
1
1
1
0
1
1
1110111 × 2+ 1 × 2+ 1 × 2+ 0 × 2+ 1 × 2+ 1 × 20

(b)


Place value
82 = 64
81 = 8
80 = 1
Number
4
7
5
4758 = 4 × 8+ 7 × 8+ 5 × 80

(c) 

Place value
53 = 125
52 = 25
51 = 5
50 = 1
Number
2
4
1
3
24132 × 5+ 4 × 5+ 1 × 5+ 3 × 50