Simultaneous Equations (Example 1 & 2)


Example 1:
Solve the simultaneous equations.
x + 1 4 y = 1  and  y 2 8 = 4 x .

Solution:
x + 1 4 y = 1 ( 1 ) y 2 8 = 4 x ( 2 ) x = 1 1 4 y ( 3 )

Substitute (3) into (2),
y 2 8 = 4 ( 1 1 4 y ) y 2 8 = 4 4 4 y
y2 + y – 12 = 0
(y + 4)(y – 3) = 0
y = –4 or y = 3 

Substitute the values of y into (3),
when y=4,  x=1 1 4 (4)=2 when y=3,  x=1 1 4 (3)= 1 4 The solutions are x=2, y=4 and x= 1 4 , y=3


Example 2:
Solve the simultaneous equations 2x + y = 1 and 2x2+ y2 + xy = 5.
Correct your answer to three decimal places.

Solution:
2x + y = 1-----(1)
2x2 + y2+ xy = 5-----(2)

From (1),
y = 1 – 2x-----(3)

Substitute (3) into (2).
2x2 + (1 – 2x)2 + x(1 – 2x) = 5
2x2 + (1 – 2x)(1 – 2x) + x – 2x2 = 5
1 – 2x – 2+ 4x2 + x – 5 = 0
4x2 – 3x – 4 = 0

From  x = b ± b 2 4 a c 2 a a = 4 ,   b = 3 c = 4 x = ( 3 ) ± ( 3 ) 2 4 ( 4 ) ( 4 ) 2 ( 4 ) x = 3 ± 73 8 x = 0.693  or  1.443

Substitute the values of x into (3).
When x = –0.693,
y = 1 – 2 (–0.693) = 2.386 (correct to 3 decimal places)

When x = 1.443,
y = 1 – 2 (1.443) = –1.886 (correct to 3 decimal places)

The solutions are x = –0.693, y  = 2.386 and x = 1.443, y = –1.886.
Quadratic Functions, SPM Practice (Long Questions)


Question 5:


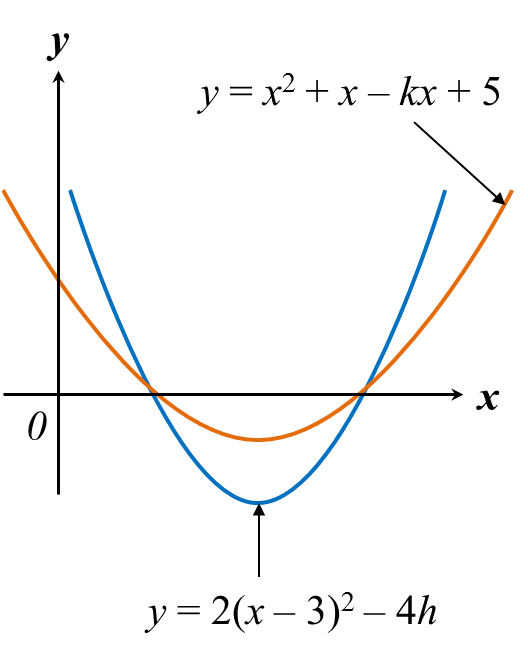
Diagram above shows the graphs of the curves y = x2 + xkx + 5 and y = 2(x – 3) – 4h that intersect the x-axis at two points. Find
(a) the value of k and of h,
(b) the minimum value of each curve.


Solution:
(a)
y= x 2 +xkx+5 = x 2 +( 1k )x+5 = [ x+ ( 1k ) 2 ] 2 ( 1k 2 ) 2 +5 axis of symmetry of the graph is x= ( 1k ) 2

y=2 ( x3 ) 2 4h axis of symmetry of the graph is x=3.   1k 2 =3 1+k=6 k=7

Substitute k=7 into equation y= x 2 +x7x+5   = x 2 6x+5 At x-axis,y=0; x 2 6x+5=0 ( x1 )( x5 )=0 x=1,5

At point ( 1,0 ) Substitute x=1,y=0 into the graph: y=2 ( x3 ) 2 4h 0=2 ( 13 ) 2 4h 4h=2( 4 ) 4h=8 h=2

(b)
For y= x 2 6x+5 = ( x3 ) 2 9+5 = ( x3 ) 2 4  Minimum value is 4. For y=2 ( x3 ) 2 8, minimum value is8.

Quadratic Functions, SPM Practice (Long Questions)


3.9.1 Quadratic Functions, SPM Practice (Long Questions)

Question 1:
Without drawing graph or using method of differentiation, find the maximum or minimum value of the function y = 2 + 4x – 3x2. Hence, find the equation of the axis of symmetry of the graph.

Solution:
By completing the square for the function in the form of y = a(x + p)2+ q to find the maximum or minimum value of the function.

y = 2 + 4x – 3x2
y = – 3x2 + 4x + 2 ← (in general form)
y = 3 [ x 2 4 3 x 2 3 ] y = 3 [ x 2 4 3 x + ( 4 3 × 1 2 ) 2 ( 4 3 × 1 2 ) 2 2 3 ] y = 3 [ ( x 2 3 ) 2 ( 2 3 ) 2 2 3 ]  

y = 3 [ ( x 2 3 ) 2 4 9 6 9 ] y = 3 [ ( x 2 3 ) 2 10 9 ] y = 3 ( x 2 3 ) 2 + 10 3 in the form of  a ( x + p ) 2 + q

Since a = –3 < 0,
Therefore, the function has a maximum value of 10 3 . 
x 2 3 = 0 x = 2 3
Equation of the axis of symmetry of the graph is x = 2 3 .   


Question 2:

The diagram above shows the graph of a quadratic function y = f(x). The straight line y = –4 is  tangent to the curve y = f(x).
(a) Write the equation of the axis of symmetry of the function f(x).
(b)   Express f(x) in the form of (x + p)2 + q , where p and q are constant.
(c) Find the range of values of x so that
(i) f(x) < 0, (ii) f(x) ≥ 0.

Solution:
(a)
x-coordinate of the minimum point is the midpoint of (–2, 0) and (6, 0)
= = 2 + 6 2 = 2  
Therefore, equation of the axis of symmetry of the function f(x) is x = 2.


(b)
Substitute x = 2 into x + p = 0,
2 + p = 0
p = –2
and q = –4 (the smallest value of f(x))
Therefore, f(x) = (x + p)2 + q
f(x) = (x – 2)2 – 4

(c)(i) From the graph, for f(x) < 0, range of values of x are –2 < x < 6 ← (below x-axis).

(c)(ii) From the graph, for f(x) ≥ 0, range of values of x are x ≤ –2 or x ≥ 6 ← (above x-axis).


Quadratic Functions, SPM Practice (Short Questions)


Question 5:
Find the range of values of k if the quadratic equation 3(x2kx – 1) = kk2 has two real and distinc roots.

Solution:
3( x 2 kx1 )=k k 2 3 x 2 3kx3k+ k 2 =0 3 x 2 3kx+ k 2 k3=0 a=3,b=3k,c= k 2 k3 In cases of two real and distinc roots, b 2 4ac>0 is applied. ( 3k ) 2 4( 3 )( k 2 k3 )>0 9 k 2 12 k 2 +12k+36>0 3 k 2 +12k+36>0 k 2 +4k+12>0 k 2 4k12<0 ( k+2 )( k6 )<0 k=2,6


The range of values of k is 2<k<6.


Question 6:
Given that the quadratic equation hx2 – (h + 2)x – (h – 4) = 0 has real and distinc roots.  Find the range of values of h.

Solution:
The quadratic equation h x 2 ( h+2 )x( h4 )=0 has real and distinc roots. b 2 4ac>0 is applied. ( h2 ) 2 4( h )( h+4 )>0 h 2 +4h+4+4 h 2 16h>0 5 h 2 12h+4>0 ( 5h2 )( h2 )>0 The coefficient of  h 2  is positive,  the region above the x-axis should be shaded. ( 5h2 )( h2 )=0 h= 2 5 ,2


The range of values of h for ( 5h2 )( h2 )>0 is h< 2 5  or h>2.

3.5b Nature of the Roots (Combination of Straight Line and a Curve)

Example 2 (Combination of Straight Line and a Curve)
The straight line y = 2 k + 1   intersects the curve y = x + k 2 x   at two distinct points.  Find the range of values of k.


Example 3 (Straight Line does not intersect the curve)
Find the range of values of m for which the straight line y = m x + 6   does not meet the curve 2 x 2 x y = 3  .


3.4 Quadratic Inequalities (Part 1)

Solving Quadratic Inequality

  1. The solution of the quadratic inequalities are the ranges of values which satisfied the inequalities itself. 
  2. There are 2 methods to solve the inequalities. 
    1. Graph method
    2. Number line method


Step to solve a Quadratic Inequalities
Step 1 : Rewrite the inequality with zero on one side and make sure a > 0
Step 2 : Find where it crosses the x-axis  (Put y = 0)
Step 3 : Sketch the graph and shade the region to find the range of values of  x


Example 
Find the range of values of x for each of the following :
(a) x 2 4 x + 3 < 0
(b) 12 + 10 x 2 x 2 < 0


Revision - Linear Inequality


Solving Quadratic Inequality - Graph Method


Solving Quadratic Inequality - Number Line Method

Suggested Video

Solving Quadratic Inequalities - The Basics

3.3b Sketching the Graph of Quadratic Functions

Graphing Quadratic Function

If you are asked to sketch the graph of a quadratic function, you need to show
a. the shape of the graph
b. the maximum/minimum point of the graph
c. the x-intercept of the graph
d. the y-intercept of the graph


Example
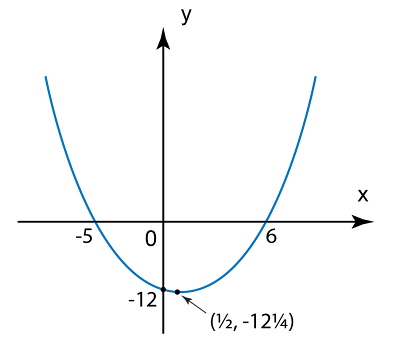
Sketch the curve of the quadratic function f ( x ) = x 2 x 12

Answer:
The shape of the graph
Since the coefficient of x2 is positive, hence the graph is a U shape parabola with a minimum point.

The minimum point of the graph
By completing the square
f ( x ) = x 2 x 12 f ( x ) = x 2 x + ( 1 2 ) 2 ( 1 2 ) 2 12 f ( x ) = ( x 1 2 ) 2 1 4 12 f ( x ) = ( x 1 2 ) 2 12 1 4 Minimum point =  ( 1 2 , 12 1 4 )

For y-intercept, x = 0
f ( 0 ) = ( 0 ) 2 ( 0 ) 12 = 12

For x-intercept, f(x) = 0
f ( x ) = x 2 x 12 0 = x 2 x 12 ( x + 5 ) ( x 6 ) = 0 x = 5  or  x = 6


Suggested Video

Graphs of Quadratic Function - khanacademy

Algebra - Quadratic Functions (Parabolas) - yaymath