Question 10:
(a) It is found that 60% of the students from a certain class obtained grade A in English in O level trial examination.
If 10 students from the class are selected at random, find the probability that
(i) exactly 7 students obtained grade A.
(ii) not more than 7 students obtained grade A.
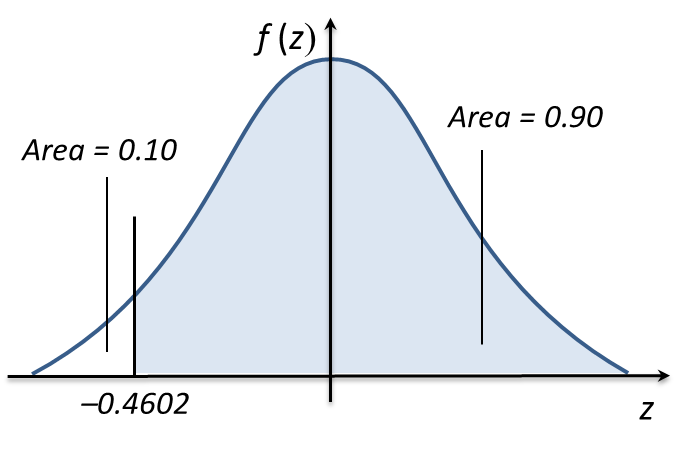
(b) Diagram below shows a standard normal distribution graph representing the volume of soy sauce in bottles produced by a factory.
 It is given the mean is 950 cm3 and the variance is 256 cm6. If the percentage of the volume more than V is 30.5%, find
(i) the value of V,
(ii) the probability that the volume between 930 cm3 and 960 cm3.
Solution:
(a) It is found that 60% of the students from a certain class obtained grade A in English in O level trial examination.
If 10 students from the class are selected at random, find the probability that
(i) exactly 7 students obtained grade A.
(ii) not more than 7 students obtained grade A.
(b) Diagram below shows a standard normal distribution graph representing the volume of soy sauce in bottles produced by a factory.
 It is given the mean is 950 cm3 and the variance is 256 cm6. If the percentage of the volume more than V is 30.5%, find
(i) the value of V,
(ii) the probability that the volume between 930 cm3 and 960 cm3.
Solution:

 Thus, the minimum mark to obtain grade A is 66.


