Short Questions (Question 7 – 9)


Question 7 (2 marks):
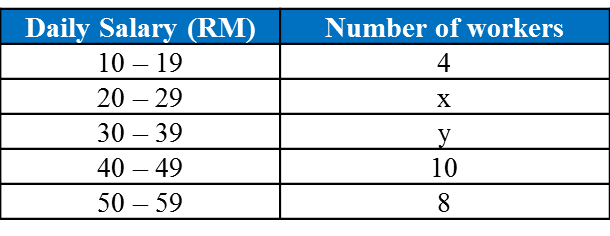
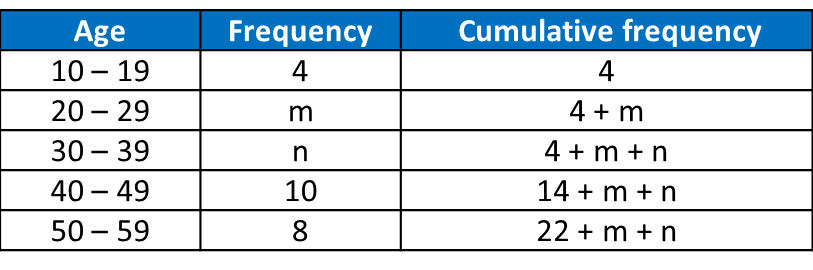
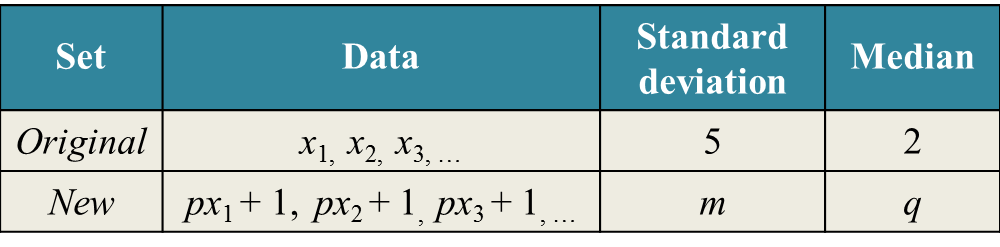
Table shows the information about a set of data.

Table

State
(a) the value of p if m = 20,
(b) the value of q if p = 2.5.

Solution:
(a)
New standard deviation = original standard deviation × p
20 = 5 × p
p = 4

(b)
New median = [original median × p] + 1
q = 2p × 1
q = 2(2.5) + 1
q = 5 + 1
q = 6


Question 8 (3 marks):
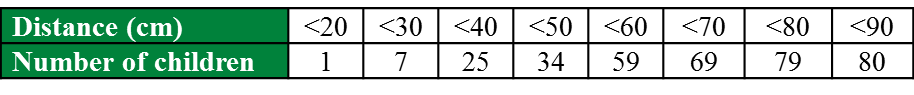
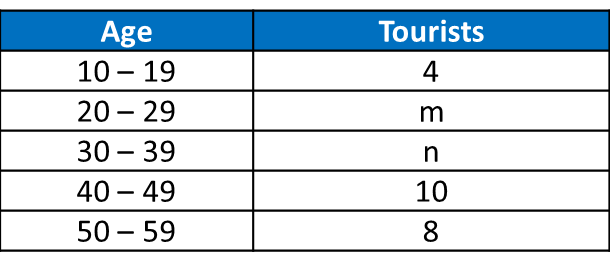
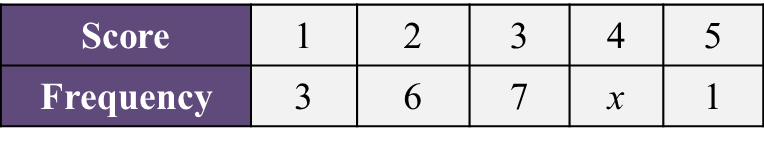
Table shows the distribution of scores obtained by a group of students in a competition.

Table

(a)
State the minimum value of x if the mode score is 4.
(b) Find the mean score of the distribution if x = 1.

Solution:
(a)
Minimum value of x = 8

(b)
Mean = 1( 3 )+2( 6 )+3( 7 )+4( 1 )+5( 1 ) 3+6+7+1+1 = 45 18 =2.5


Question 9 (4 marks):
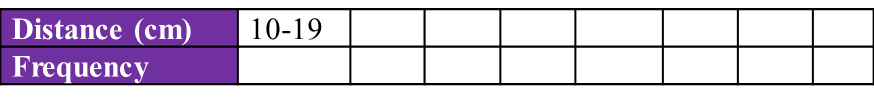
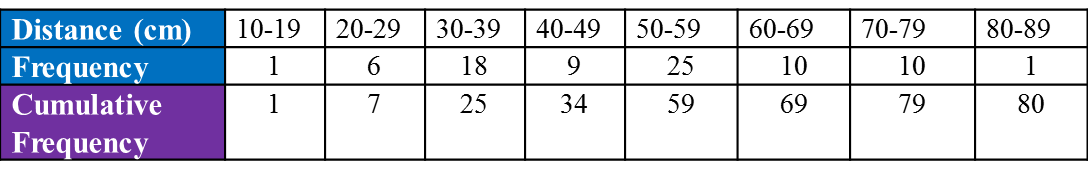
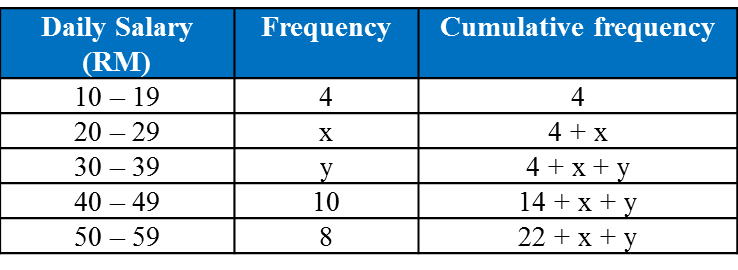
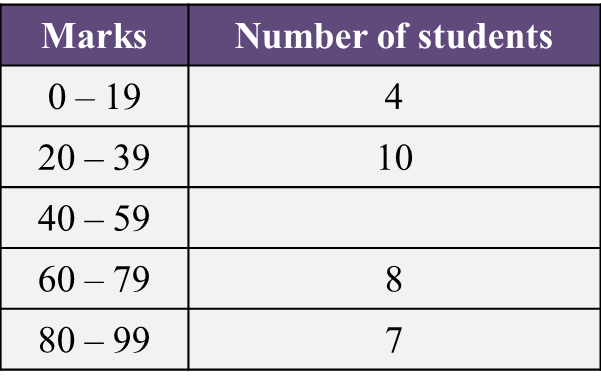
Table shows the distribution of marks for 40 students in an Additional Mathematics test. The number of students for the class interval 40 – 59 is not stated.

Table

(a) State the modal class.
(b) Puan Zainon, the subject teacher, intends to give a reward to the top ten students. Those students who achieve the minimum mark in the top ten placing will be considered to receive the reward. Elina obtains 74 marks.
Does Elina qualify to be considered to receive the reward? Give your reason.

Solution:
(a)
4 + 10 + x + 8 + 7 = 40
x + 29 = 40
x = 11

Modal class = 40 – 59

(b)
The top ten placings are  T 31 ,  T 32 ,  T 33 , ...  T 40 T 31 =59.5+ 5 8 ( 79.559.5 ) =59.5+12.5 =72 A student has to achieve a minimum mark of 72. Elina qualifies for the reward because her marks > 72 marks.

Long Questions (Question 5 & 6)


Question 5:
The table shows the cumulative frequency distribution for the distance travelled by 80 children in a competition.


(a) Based on the table above, copy and complete the table below.


(b) Without drawing an ogive, estimate the interquartile range of this data.


Solution:
(a)


(b)
Interquartile range = Third Quartile – First Quartile

Third Quartile class, Q3 = ¾ × 80 = 60
Therefore third quartile class is the class 60 – 69.

First Quartile class, Q1= ¼ × 80 = 20
Therefore first quartile class is the class 30 – 39.

Interquartile Range = L Q 3 + ( 3 N 4 F f Q 3 ) c L Q 1 + ( N 4 F f Q 1 ) c = 59.5 + ( 3 4 ( 80 ) 59 10 ) 10 29.5 + ( 1 4 ( 80 ) 7 18 ) 10 = 59.5 + 1 ( 29.5 + 7.22 ) = 23.78


Question 6:
Table shows the daily salary obtained by 40 workers in a construction site.


Given that the median daily salary is RM35.5, find the value of x and of y.
Hence, state the modal class.


Solution:


Total workers = 40
22 + x + y = 40
x = 18 – y ------(1)

Median daily salary = 35.5
Median class is 30 – 39

m = L + ( N 2 F f m ) c 35.5 = 29.5 + ( 40 2 ( 4 + x ) y ) 10 6 = ( 16 x y ) 10 6 y = 160 10 x 3 y = 80 5 x ( 2 )

Substitute (1) into (2):
3y = 80 – 5(18 – y)
3y = 80 – 90 + 5y
–2y = –10
y = 5
Substitute y = 5 into (1)
x = 18 – 5 = 13
Thus x = 13 and y = 5.

The modal class is 20 – 29 daily salary (RM).

Long Questions (Question 3 & 4)


Question 3:
The mean of the data 1, a, 2a, 8, 9 and 15 which has been arranged in ascending order is b. If each number of the data is subtracted by 3, the new median is 4 7 b . Find
(a) The values of a and b,
(b) The variance of the new data.

Solution:
(a)
Mean  x ¯ = b 1 + a + 2 a + 8 + 9 + 15 6 = b 33 + 3 a = 6 b 3 a = 6 b 33 a = 2 b 11  ------(1) New median  = 4 b 7 ( 2 a 3 ) + ( 8 3 ) 2 = 4 b 7 2 a + 2 2 = 4 b 7 14 a + 14 = 8 b 7 a = 4 b 7  ------(2) Substitute (1) into (2), 7 ( 2 b 11 ) = 4 b 7 14 b 77 = 4 b 7 10 b = 70 b = 7 From (1),  a = 2 ( 7 ) 11 = 3


(b)

New data is (1 – 3), (3 – 3), (6 – 3), (8 – 3), (9 – 3), (15 – 3)
New data is  – 2, 0, 3, 5, 6, 12

Variance,  σ 2 = x 2 N x ¯ 2 σ 2 = ( 2 ) 2 + ( 0 ) 2 + ( 3 ) 2 + ( 5 ) 2 + ( 6 ) 2 + ( 12 ) 2 6 ( 2 + 0 + 3 + 5 + 6 + 12 6 ) 2 σ 2 = 218 6 16 = 20.333


Question 4:
A set of data consists of 20 numbers. The mean of the numbers is 8 and the standard deviation is 3.

(a) Calculate   x and x 2 .

(b) A sum of certain numbers is 72 with mean of 9 and the sum of the squares of these numbers of 800, is taken out from the set of 20 numbers. Calculate the mean and variance of the remaining numbers.

Solution:
(a)
Mean  x ¯ = x N 8 = x 20 x = 160 Standard deviation,  σ = x 2 N x ¯ 2 3 = x 2 N x ¯ 2 9 = x 2 20 8 2 x 2 20 = 73 x 2 = 1460


(b)
Sum of certain numbers,  M  is 72 with mean of  9 , 72 M = 9 M = 8 Mean of the remaining numbers = 160 72 20 8 = 7 1 3 Variance of the remaining numbers = 1460 800 12 ( 7 1 3 ) 2 = 55 53 7 9 = 1 2 9

Long Questions (Question 1 & 2)


Question 1:
Table shows the age of 40 tourists who visited a tourist spot.


Given that the median age is 35.5, find the value of
m and of n.
  
Solution:
Given that the median age is 35.5, find the value of m and of n.


22 + m + n = 40
n = 18 – m -----(1)
Given median age = 35.5, therefore median class = 30 – 39

35.5 = 29.5 + ( 20 ( 4 + m ) n ) × 10 6 = ( 16 m n ) × 10
6n = 160 – 10m
3n = 80 – 5m -----(2)

Substitute (1) into (2).
3 (18 – m) = 80 – 5m
54 – 3m = 80 – 5m
2m = 26
m = 13

Substitute m = 13 into (1).
n = 18 – 13
n = 5

Thus m = 13, n = 5.


Question 2:
A set of examination marks x1, x2, x3, x4, x5, x6 has a mean of 6 and a standard deviation of 2.4.
(a) Find
(i) the sum of the marks, Σ x ,
(ii) the sum of the squares of the marks, Σ x 2 .

(b)
Each mark is multiplied by 2 and then 3 is added to it.
Find, for the new set of marks,
(i) the mean,
(ii) the variance.

Solution:
(a)(i)
Given mean = 5 Σ x 6 = 6 Σ x = 36

(a)(ii)
Given  σ = 2.4 σ 2 = 2.4 2 Σ x 2 n X ¯ 2 = 5.76 Σ x 2 6 6 2 = 5.76 Σ x 2 6 = 41.76 Σ x 2 = 250.56

(b)(i)
Mean of the new set of numbers
= 6(2) + 3
= 15

(b)(ii) 
Variance of the original set of numbers
 = 2.42 = 5.76

Variance of the new set of numbers
= 22 (5.76)
= 23.04

Short Questions (Question 10 & 11)


Question 10:
A set of data consists of twelve positive numbers.
It is given that Σ ( x x ¯ ) 2 =600 and Σ x 2 =1032.
Find
(a) the variance
(b) the mean

Solution:
(a)
Variance= Σ ( x x ¯ ) 2 N               = 600 12               =50

(b)
Variance= Σ x 2 N ( x ¯ ) 2           50= 1032 12 ( x ¯ ) 2        ( x ¯ ) 2 =8650              =36             x ¯ =36


Question 11 (4 marks):
A set of data consists of 2, 3, 4, 5 and 6. Each number in the set is multiplied by m and added by n, where m and n are integers. It is given that the new mean is 17 and the new standard deviation is 4.242.
Find the value of m and of n.

Solution:

x =2+3+4+5+6=20 x 2 = 2 2 + 3 2 + 4 2 + 5 2 + 6 2 =90 Mean= 20 5 =4 Variance= x 2 n ( x ¯ ) 2   = 90 5 4 2 =2 New mean=17 4m+n=17 .......... ( 1 ) New standard deviation=4.242 m× 2 =4.242 m= 4.242 2 =2.99953 Substitute m=3 into ( 1 ): 4( 3 )+n=17 n=5

Short Questions (Question 5 & 6)


Question 5:
A set of data consists of 9, 2, 7, x2 – 1 and 4. Given the mean is 6, find
(a) the positive value of x,
(b) the median using the value of x in part (a).

Solution:
(a)
Mean=6 9+2+7+ x 2 1+4 5 =6                      x 2 +21=30                             x 2 =9                              x=±3 Positive value of x=3.

(b)
Arrange the numbers in ascending order
2, 4, 7, 8, 9
Median = 7


Question 6:
A set of seven numbers has a standard deviation of 3 and another set of three numbers has a standard deviation of 4. Both sets of numbers have an equal mean.
If the two sets of numbers are combined, find the variance.

Solution:
X ¯ 1 = Σ X 1 n 1 m= Σ X 1 7 Σ X 1 =7m m= Σ X 2 3 Σ X 2 =3m σ= Σ X 2 N ( X ¯ ) 2 σ 2 = Σ X 2 N ( X ¯ ) 2 9= Σ X 1 2 7 m 2 63=Σ X 1 2 7 m 2 Σ X 1 2 =7 m 2 +63

Similarly: 16= Σ X 2 2 3 m 2 48=Σ X 2 2 3 m 2 Σ X 2 2 =48+3 m 2 Σ Y 2 =Σ X 1 2 +Σ X 2 2 Σ Y 2 =7 m 2 +63+3 m 2 +48       =10 m 2 +111 ΣY=Σ X 1 +Σ X 2 ΣY=7m+3m=10m Combine Variance: σ 2 = Σ Y 2 N ( ΣY N ) 2 σ 2 = 10 m 2 +111 10 ( 10m 10 ) 2     = 10 m 2 +111 10 m 2     = 10 m 2 +11110 m 2 10     = 111 10 =11.1

Short Questions (Question 3 & 4)


Question 3:
The mean of five numbers is p . The sum of the squares of the numbers is 120 and the standard deviation is 2q. Express p in terms of q.

Solution:
Mean  x ¯ = x N p = x 5 x = 5 p Standard deviation,  σ = x 2 N x ¯ 2 2 q = 120 5 ( p ) 2 4 q 2 = 24 p p = 24 4 q 2


Question 4:
A set of positive integers consists of 1, 4 and p. The variance for this set of integers is 6. Find the value of p.

Solution:
Variance,  σ 2 = x 2 N x ¯ 2 6 = 1 2 + 4 2 + p 2 3 ( 1 + 4 + p 3 ) 2 6 = 17 + p 2 3 ( 5 + p 3 ) 2 6 = 17 + p 2 3 [ 25 + 10 p + p 2 9 ] 6 = 51 + 3 p 2 25 10 p p 2 9 2 p 2 10 p + 26 = 54 2 p 2 10 p + 28 = 0 p 2 5 p + 14 = 0 ( p 7 ) ( p + 2 ) = 0 p = 2  (not accepted) p = 7

Short Questions (Question 1 & 2)


Question 1:
Given that the standard deviation of five numbers is 6 and the sum of the squares of these five numbers is 260.  Find the mean of this set of numbers.

Solution:

Given that  σ = 6 Σ x 2 = 260. σ = 6 Σ x 2 n X ¯ 2 = 6 Σ x 2 n X ¯ 2 = 36 260 5 X ¯ 2 = 36 X ¯ 2 = 16 X ¯ = ± 4 mean =  ± 4


Question 2:
Both of the mean and the standard deviation of 1, 3, 7, 15, m and n are 6.  Find
(a) the value of m + n,
(b) the possible values of  n.

Solution:
(a)
Given mean = 6 Σ x n = 6 Σ x 6 = 6  
1 + 3 + 7 + 15 + m + n= 36
26 + m + n= 36
m + n = 10

(b)
σ = 6 σ 2 = 36 Σ x 2 n X ¯ 2 = 36 1 + 9 + 49 + 225 + m 2 + n 2 6 6 2 = 36 284 + m 2 + n 2 6 36 = 36 284 + m 2 + n 2 6 = 72 284 + m 2 + n 2 = 432 m 2 + n 2 = 148 From (a),  m = 10 n ( 10 n ) 2 + n 2 = 148 100 20 n + n 2 + n 2 = 148 2 n 2 20 n 48 = 0 n 2 10 n 24 = 0 ( n 6 ) ( n + 4 ) = 0 n = 6  or  4

Measures of Dispersion (Part 3)

Measures of Dispersion (Part 3)
7.3 Variance and Standard Deviation

1. The variance is a measure of the mean for the square of the deviations from the mean.

2. The standard deviation refers to the square root for the variance.

(A) Ungrouped Data


Example 1:
Find the variance and standard deviation of the following data.
15, 17, 21, 24 and 31

Solution:
Variance,  σ 2 = x 2 N x ¯ 2 σ 2 = 15 2 + 17 2 + 21 2 + 24 2 + 31 2 5 ( 15 + 17 + 21 + 24 + 31 5 ) 2 σ 2 = 2492 5 21.6 2 σ 2 = 31.84 Standard deviation,  σ  =  variance σ  =  31.84 σ  =  5.642


(B) Grouped Data (without Class Interval)


Example 2:
The data below shows the numbers of children of 30 families:

Number of child
2
3
4
5
6
7
8
Frequency
6
8
5
3
3
3
2


Find the variance and standard deviation of the data.


Solution:
Mean  x ¯ = f x f = ( 6 ) ( 2 ) + ( 8 ) ( 3 ) + ( 5 ) ( 4 ) + ( 3 ) ( 5 ) + ( 3 ) ( 6 ) + ( 3 ) ( 7 ) + ( 2 ) ( 8 ) 6 + 8 + 5 + 3 + 3 + 3 + 2 = 126 30 = 4.2 f x 2 f = ( 6 ) ( 2 ) 2 + ( 8 ) ( 3 ) 2 + ( 5 ) ( 4 ) 2 + ( 3 ) ( 5 ) 2 + ( 3 ) ( 6 ) 2 + ( 3 ) ( 7 ) 2 + ( 2 ) ( 8 ) 2 6 + 8 + 5 + 3 + 3 + 3 + 2 = 634 30 = 21.13 Variance,  σ 2 = f x 2 f x ¯ 2 σ 2 = 21.133 4.2 2 σ 2 = 3.493 Standard deviation,  σ  =  variance σ  =  3.493 σ  = 1 .869


(C) Grouped Data (with Class Interval)


Example 3:

Daily Salary(RM)
Number of workers
10 – 14
40
15 – 19
25
20 – 24
15
25 – 29
12
30 – 34
8
Find the mean of daily salary and its standard deviation.

Solution:

Daily Salary (RM)
Number of workers, f
Midpoint, x
fx
fx2
10 – 14
40
12
480
5760
15 – 19
25
17
425
7225
20 – 24
15
22
330
7260
25 – 29
12
27
324
8748
30 – 34
8
32
256
8192
Total
100

1815
37185
Mean  x ¯ = f x f Mean of daily salary = 1815 100 = 18.15 Variance,  σ 2 = f x 2 f x ¯ 2 Standard deviation,  σ  =  variance σ 2 = 37185 100 18.15 2 σ 2 = 42.43 σ  =  42.43 σ  = 6 .514

Measures of Dispersion (Part 2)


Measures of Dispersion (Part 2)
7.2b Interquartile Range 2

(C) Interquartile Range of Grouped Data (with Class Interval)

The interquartile range of grouped data can be determined by Method 1 (using a cumulative frequency table) or Method 2 (using an ogive).


Example:
The table below shows the marks obtained by a group of Form 4 students in school mathematics test.


Estimate the interquartile range.

Solution:
Method 1: From Cumulative Frequency Table
Step 1:
Lower quartile, Q1 = the   1 4 ( 60 ) th observation
   = the 15thobservation

Upper quartile, Q3 = the   3 4 ( 60 ) th observation
   = the 45thobservation


Step 2:
Lower quartile,  Q 1 = L 1 + ( 1 4 N F 1 f Q 1 ) C   = 39.5 + ( 15 12 20 ) 10   = 39.5 + 1.5   = 41

Step 3:
Upper quartile,  Q 3 = L 3 + ( 3 4 N F 3 f Q 3 ) C     = 49.5 + ( 45 32 16 ) 10     = 49.5 + 8.125     = 57.625

Step 4:
Interquartile Range
= upper quartile – lower quartile
= Q3Q1
= 57.625 – 41
= 16.625