9.6 SPM Practice (Long Questions)


Question 9 (12 marks):
(a) Diagram 9.1 shows point P (5, 1) on a Cartesian plane.
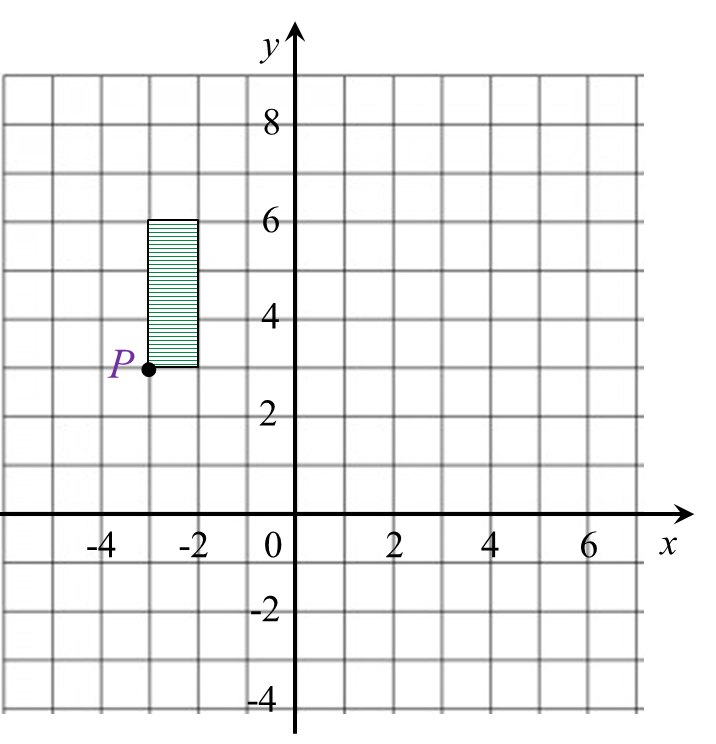
Diagram 9.1

Transformation T is a translation  (  4 3 )
Transformation S is an enlargement about the centre (–5, 2) with a scale factor 2.
State the coordinates of the image of point P under the following transformations:
(i) T2,
(ii) TS.


(b) Diagram  9.2 shows geometrical shapes KLMNP, KSRQP and KTUVW drawn on a Cartesian plane.
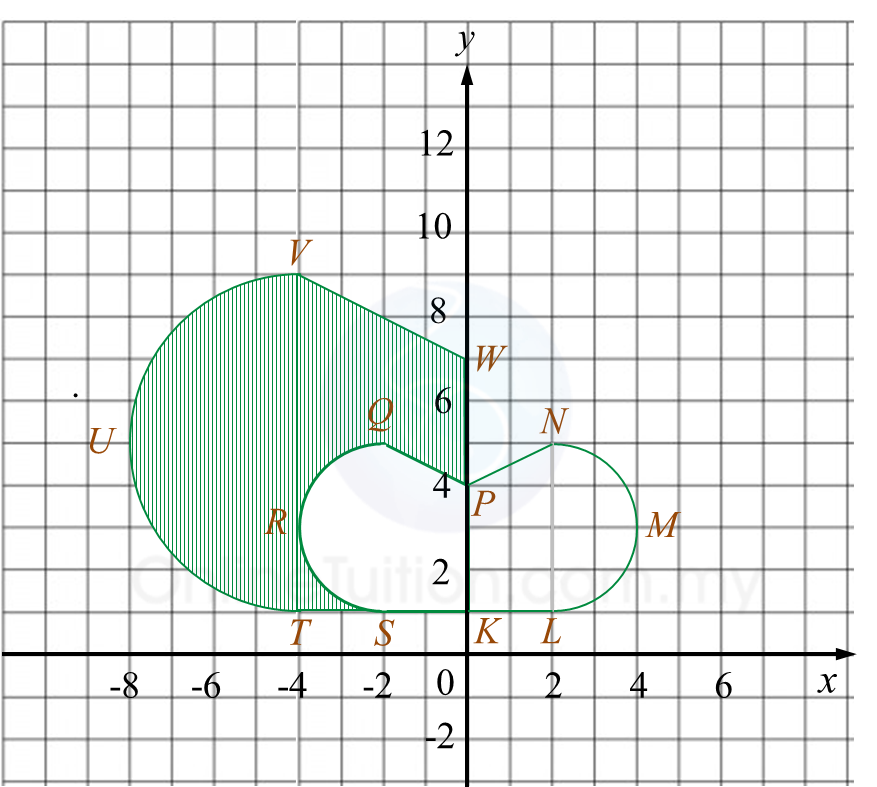
Diagram 9.2

(i)
KTUVW is the image of KLMNP under the combined transformation YZ.
Describe, in full, the transformation:
(a) Z,
(b) Y.

(ii) It is given that KSRQP represents a region of area 30 m2.
Calculate the area, in m2, of the shaded region.


Solution:
(a)
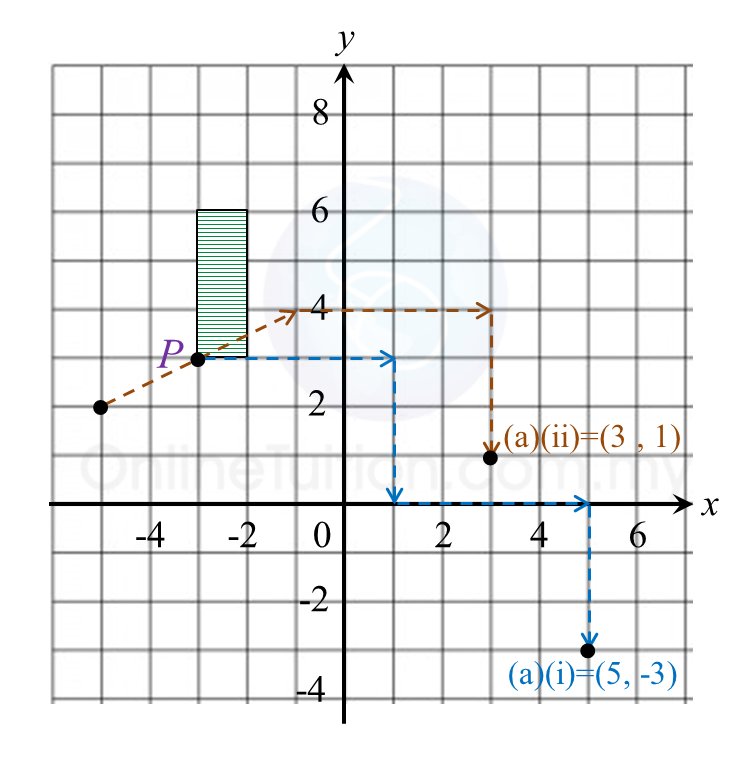

(i)
TT = P(–3, 3) → T1 → P’(1, 0) ) → T2 → P’’(5, –3)
(ii) TS =  P (–3, 3) → S → P’(–1, 4) → T → P’’(3, 1)


(b)(i)(a)
Z: Reflection in the line x = 0.

(b)(i)(b)
Y: Enlargement with the centre at (0, 0) and a scale factor of 2.

(b)(ii)
Area of KTUVW = (Scale factor)2 × Area of object
= 22 × 30
= 120 m2

Hence,
Area of shaded region
= Area KTUVW – Area KSRQP
= 120 – 30
= 90 m2

9.6 SPM Practice (Long Questions)


Question 9 (12 marks):
A(25o N, 35o E), B(25o N, 40o W), C and D are four points which lie on the surface of the earth. AD is the diameter of the common parallel latitude 25o N .
(a) Find the longitude of D.

(b)
C lies 3300 nautical miles due south of measured along the surface of the earth.
Calculate the latitude of C.

(c)
Calculate the shortest distance, in nautical mile, from to measured along the surface of the earth.

(d)
An aeroplane took off from C and flew due north to point A. 
The total time taken for the whole flight was 12 hours 24 minutes.

(i)
Calculate the distance, in nautical mile, from A due west to measured along the common parallel of latitude.

(ii)
Calculate the average speed, in knot, of the whole flight.


Solution:
(a) 
Longitude of D = (180o – 35o)W
= 145oW

(b)
AOC= 3300 60 = 55 o Latitude of C = ( 5525 ) o S = 30 o S

(c) 
Shortest distance of to D
= (65o + 65o) × 60’
= 130o × 60’
= 7800 nautical miles

(d)(i) 
Distance from A to B
= (35o + 40o) × 60’ × cos 25o
= 75o × 60’ × cos 25o
= 4078.4 nautical miles

(d)(ii)
Total distance travelled =CA+AB =3300+4078.4 =7378.4 nautical miles Average speed= Total distance Total time = 7378.4 12.4  knot =595.0 knot


9.6 SPM Practice (Long Questions)


Question 8 (12 marks):
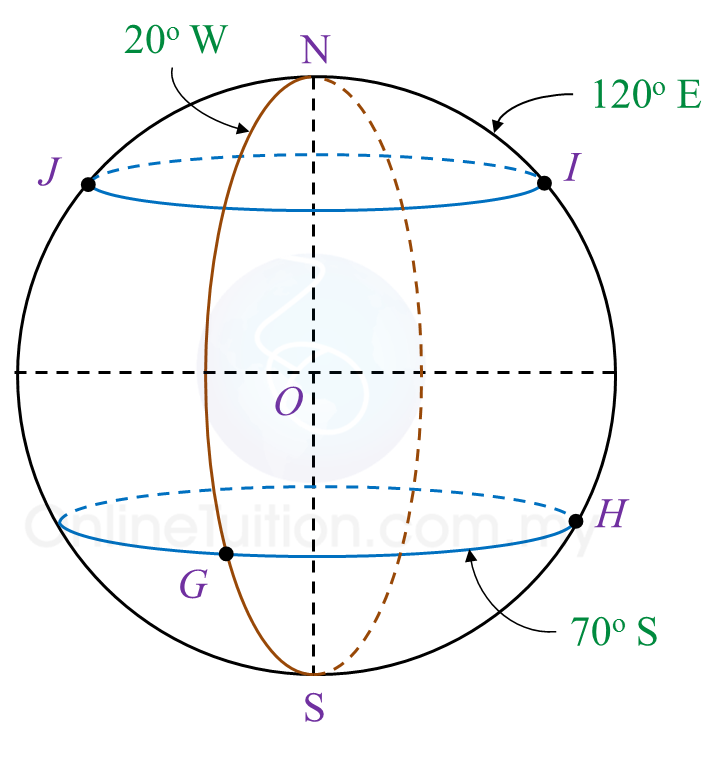
Diagram 8 shows four points, G, H, I and J on the surface of the Earth. JI is the diameter of the parallel of latitude 50o N. O is the centre of the Earth.

Diagram 8

(a)
 State the location of G.

(b) Calculate the shortest distance, in nautical mile, from I to J measured along the surface of the Earth.

(c) Calculate the shortest distance, in nautical mile, from G to H measured along the common parallel of latitude.

(d) An aeroplane took off from I and flew due south to point P. The average speed of the journey was 800 knots. The time taken for the flight was 5.25 hours.
Calculate the latitude of P.


Solution:
(a)
Location of G = (70o S, 20o W)

(b)
∠ JOI
= 180o – 50o – 50o 
= 80o
Distance of I to J
= 80o × 60’
= 4800 nautical miles

(c)
Distance of G to H
= (20o + 120o) × 60’ × cos 70o
= 140o × 60’ × cos 70o
= 2872.97 nautical miles

(d)

Average speed= Total distance travelled Total time taken 800= x 5.25 x=4200 nautical miles I to P=4200 Difference between parallel=y y×60=4200 y= 70 o Thus, latitude of P = 70 o 50 o = 20 o S

9.6 SPM Practice (Long Questions)


Question 7 (12 marks):
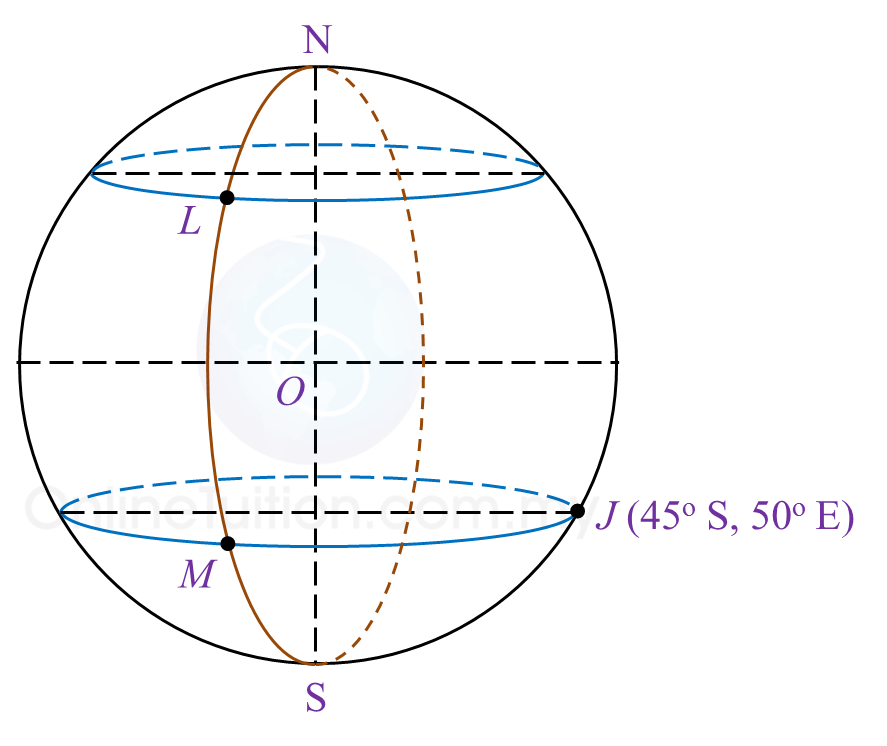
Diagram 7 in the answer space shows the locations of points J, L and M, which lie on the surface of the earth. O is the centre of the earth. The longitude of M is 30o W. K is another point on the surface of the earth such that KJ is the diameter of the common parallel of latitude 45o S.

(a)(i)
Mark and label point K on Diagram 7 in the answer space.

(ii)
 Hence, state the longitude of point K.

(b)
L lies due north of M and the shortest distance from M to L measured along the surface of the earth is 7500 nautical miles.
Calculate the latitude of L.

(c)
 Calculate the distance, in nautical mile, from K due east to M measured along the common parallel of latitude.

(d)
 An aeroplane took off from K and flew due east to M along the common parallel of latitude. The average speed of the aeroplane for the flight was 750 knots.
Calculate the total time, in hour, taken for the whole flight.


Answer:


Solution:
(a)(i)


(a)(ii)
Longitude of point K = 130oW

(b)
 LOM×60=7500  LOM= 7500 60  LOM= 125 o Latitude of L= 125 o 45 o = 80 o N

(c)
KM = (130o – 30o) × 60 × cos 45o
= 4242.64 nautical miles

(d)
Time= Distance speed = 4242.64 750 =5.66 hours


10.3 SPM Practice (Long Questions)


Question 7 (12 marks):
You are not allowed to use graph paper to answer this question.

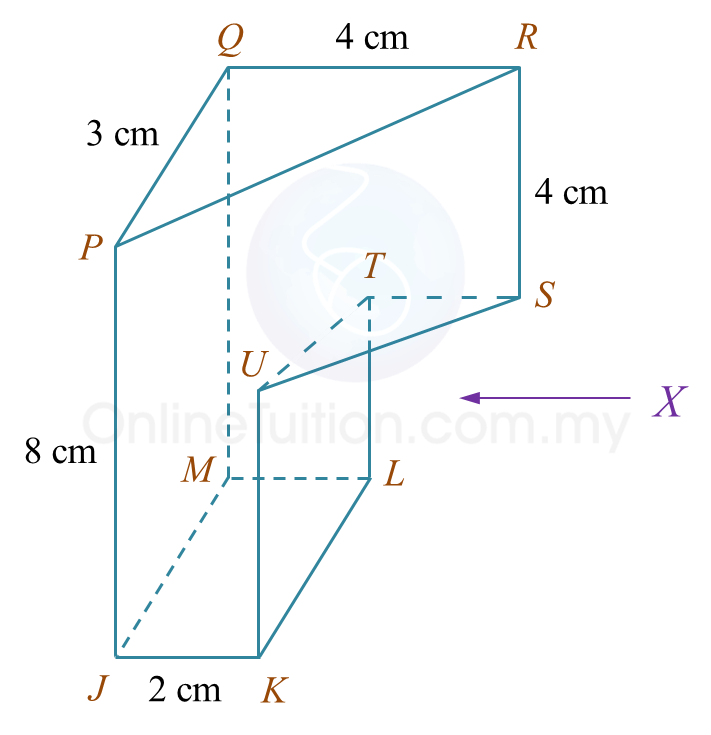
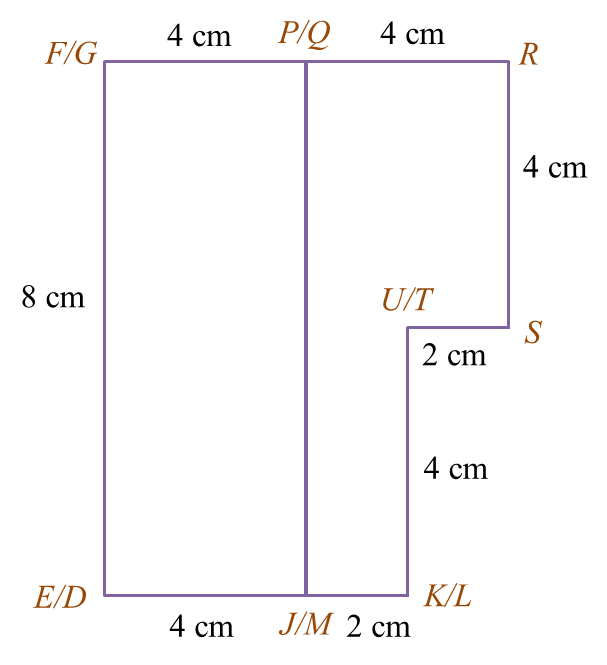
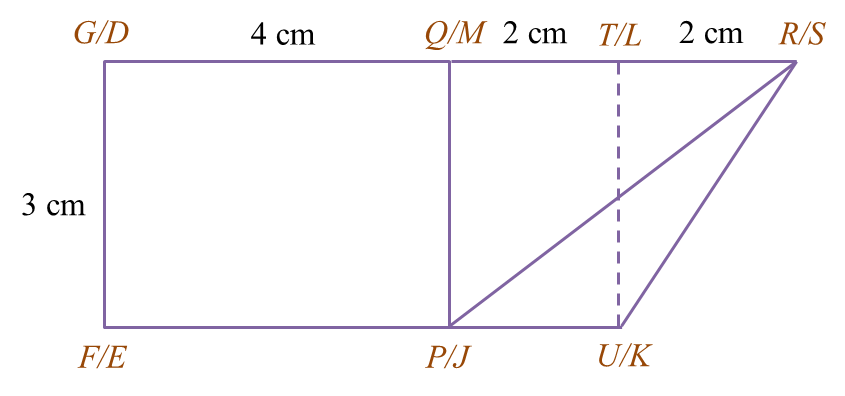
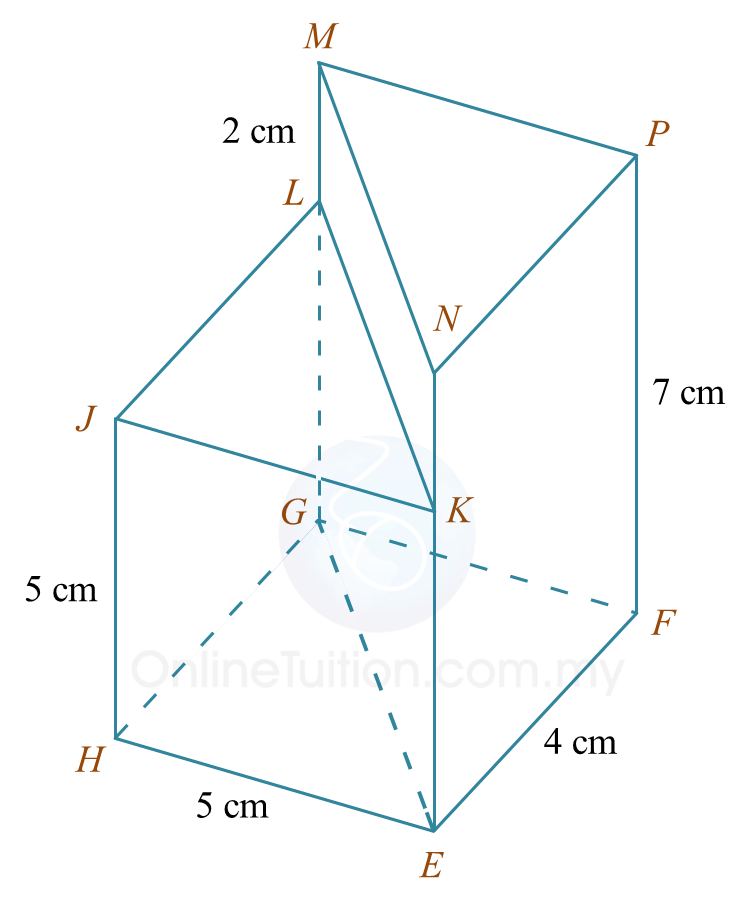
(a) Diagram 7.1 shows a solid prism with a rectangular base JKLM on a horizontal plane. The surface MQRSTL is the uniform cross section of the prism. Triangle STU and PQR are horizontal planes. Edges PJ, RS and UK are vertical. PQ = TU = 3 cm.

Diagram 7.1

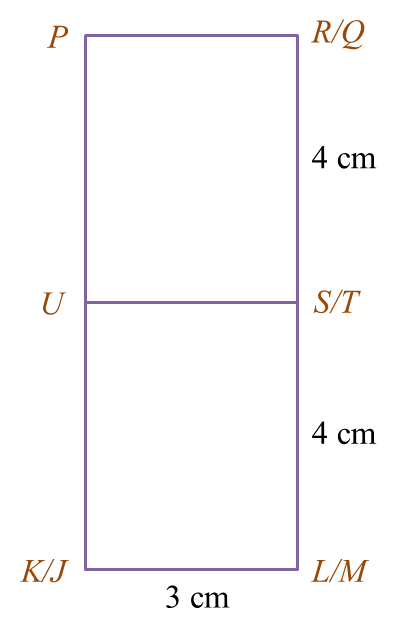
Draw to full scale, the elevation of the solid on a vertical plane parallel to KL as viewed from X.


(b)
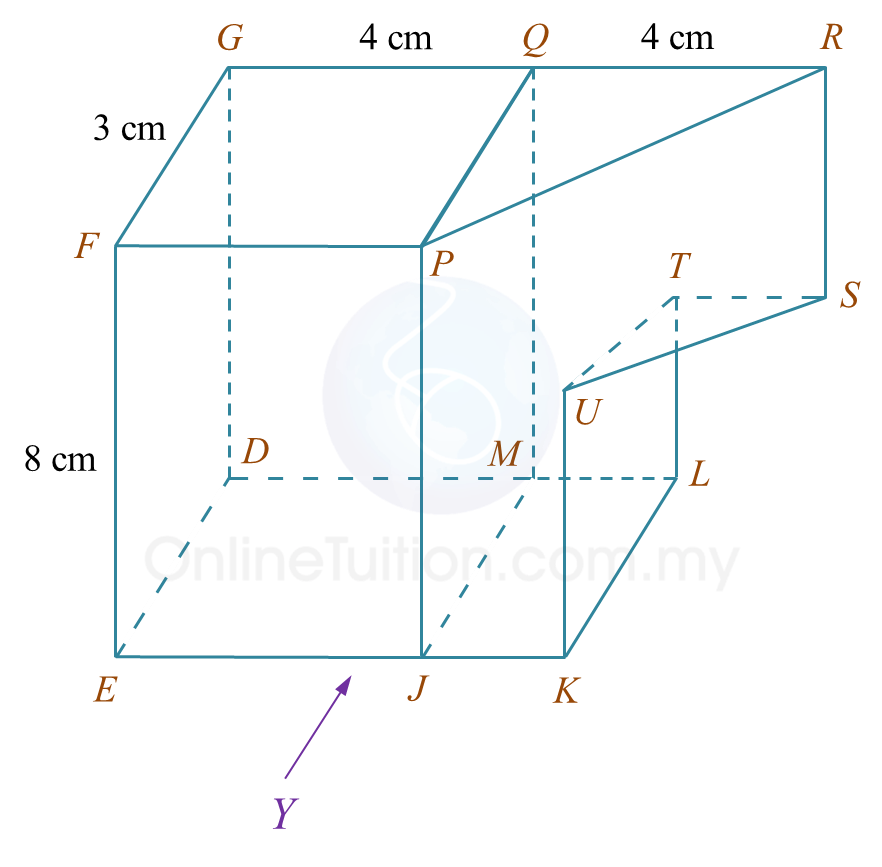
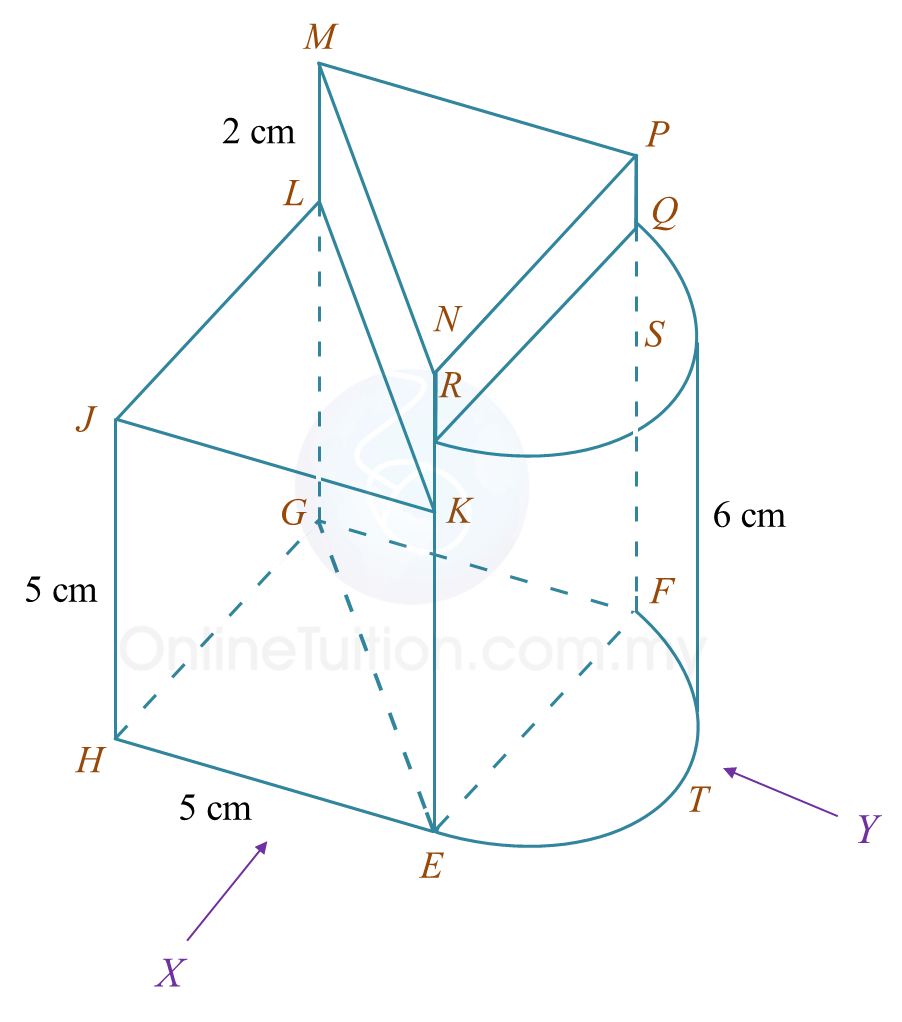
 Another solid cuboid with rectangle base JMDE is combined to the prism in Diagram 7.1 at the vertical plane JMQP. The composite solid is as shown in Diagram 7.2. The base EJKLMD lies on a horizontal plane.

Diagram 7.2

Draw to full scale,
(i) the elevation of the composite solid on a vertical plane parallel to EJK as viewed from Y.
(ii) the plan of the composite solid.


Solution:
(a)


(b)(i)


(b)(ii)


10.3 SPM Practice (Long Questions)


Question 6 (12 marks):
You are not allowed to use graph paper to answer this question.

(a) Diagram 6.1 shows two solid right prisms joined at the vertical plane EGLK. The planes JKL and MNP are the uniform cross sections of the prism HEGLJK and prism EFGMNP respectively. The base EFGH is a rectangle which lies on a horizontal plane. Edges HJ and EK are vertical.

Diagram 6.1

Draw, to full scale, the plan of the composite solid.


(b)
Another solid half cylinder with a diameter of 4 cm is joined to the prism in Diagram 9.1 at the vertical plane EFQR. The composite solid is as shown in Diagram 6.2. The base HETFG lies on a horizontal plane.

Diagram 6.2

Draw to full scale,
(i) the elevation of the composite solid on a vertical plane parallel to HE as viewed from X.
(ii) the elevation of the composite solid on a vertical plane parallel to EF as viewed from Y.


Solution:
(a)


(b)(i)


(b)(ii)


10.3 SPM Practice (Long Questions)


Question 5 (12 marks):
You are not allowed to use graph paper to answer this question.

(a)
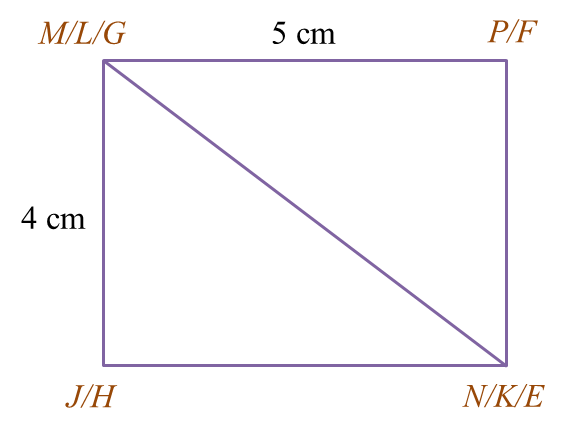
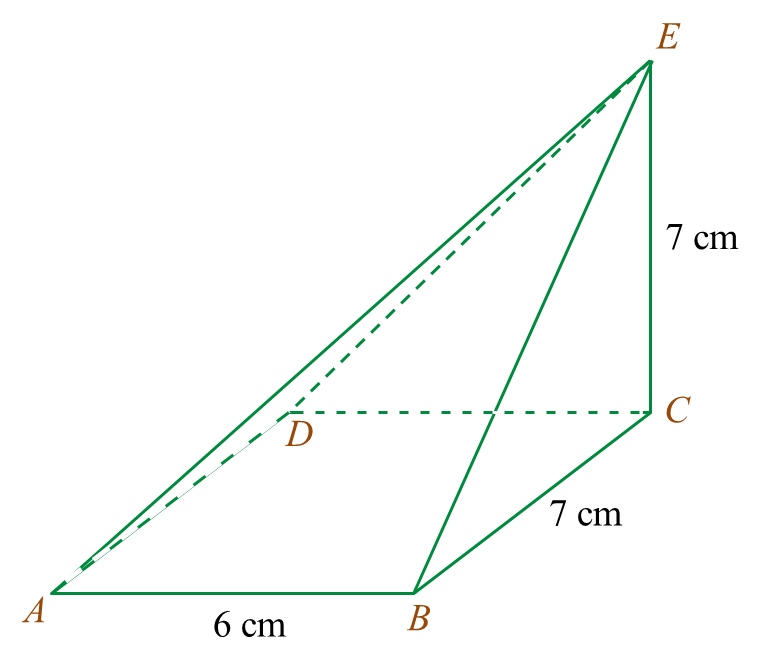
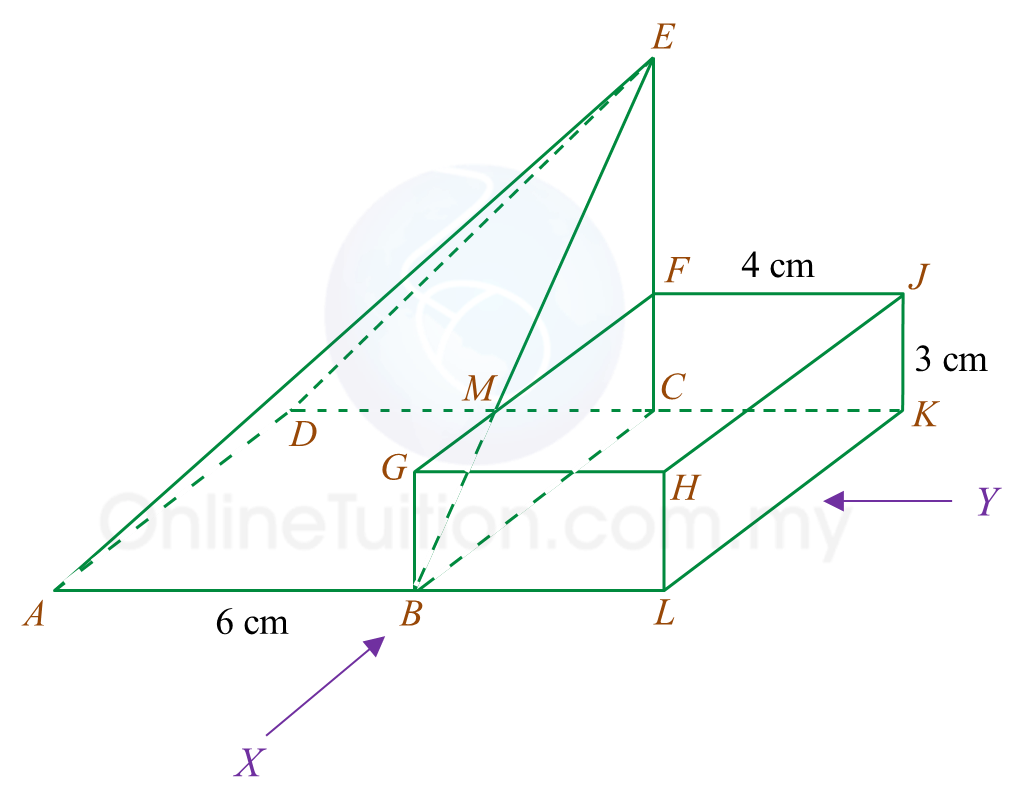
Diagram 5.1 shows a pyramid with rectangular base ABCD on a horizontal plane. Vertex E is vertically above C. Triangles BCE and DCE are vertical planes. Triangles ABE and ADE are inclined planes.

Diagram 5.1

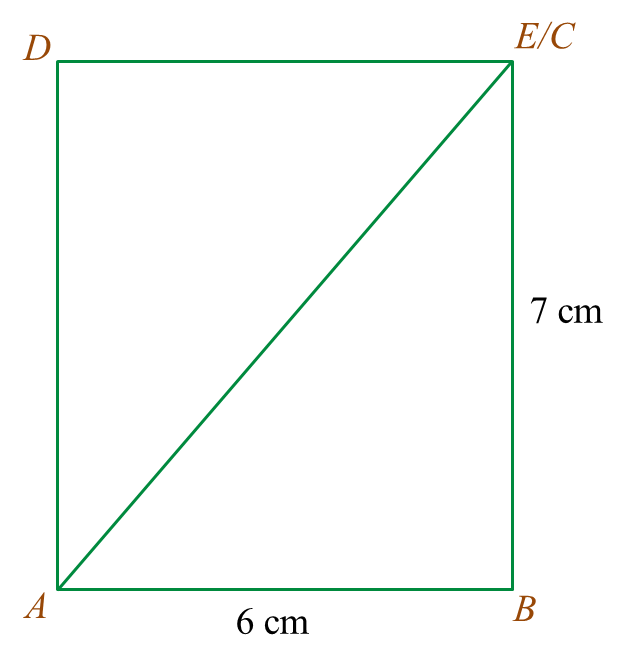
Draw to full scale, the plan of the solid.


(b)
Another solid cuboid with rectangle base BLKC is joined to the pyramid in Diagram 5.1 at the vertical plane BCFM. The composite solid is as shown in Diagram 5.2. The base ABLKCD lies on a horizontal plane

Diagram 5.2

Draw to full scale,
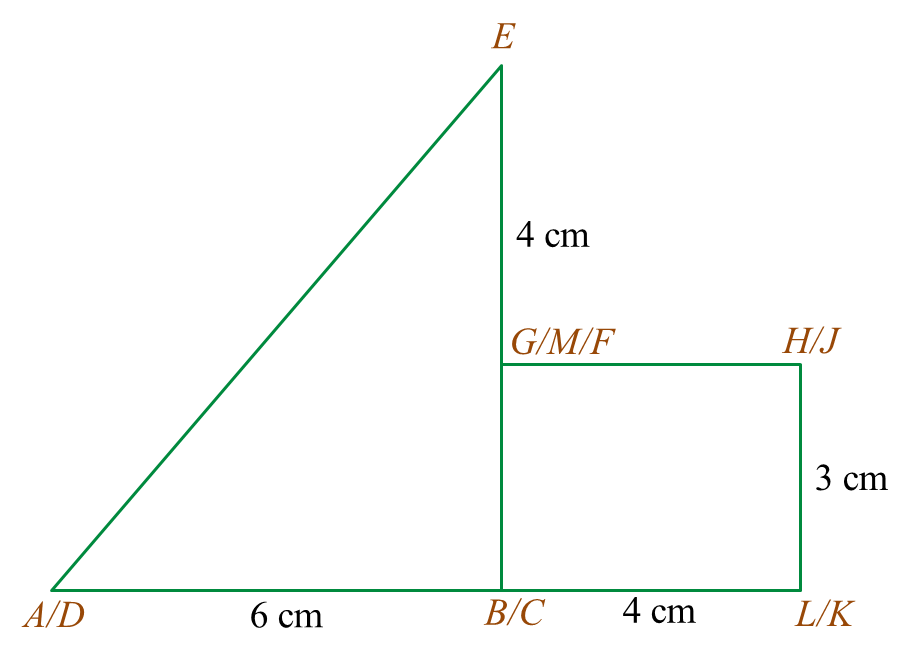
(i) the elevation of the composite solid on a vertical plane parallel to ABL as viewed from X.

(ii)
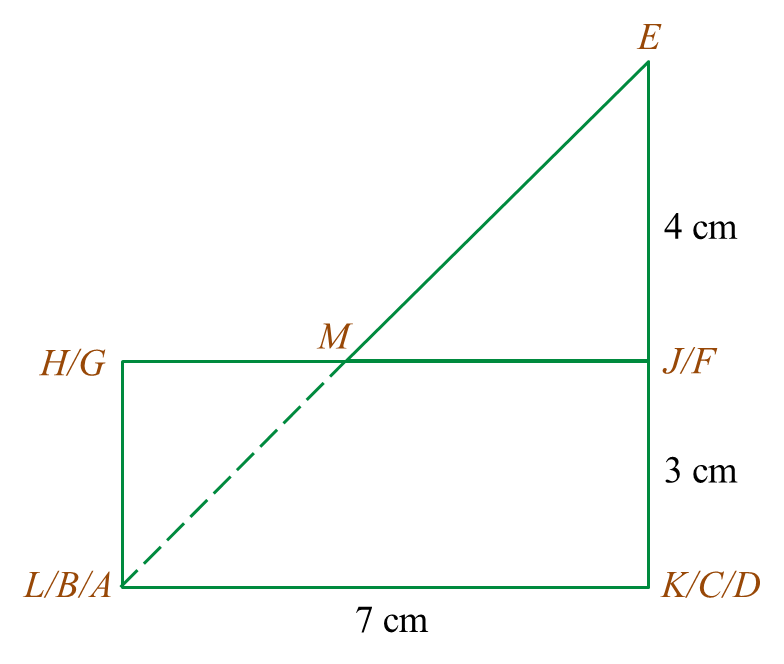
the elevation of the composite solid on a vertical plane parallel to LK as viewed from Y.


Solution:

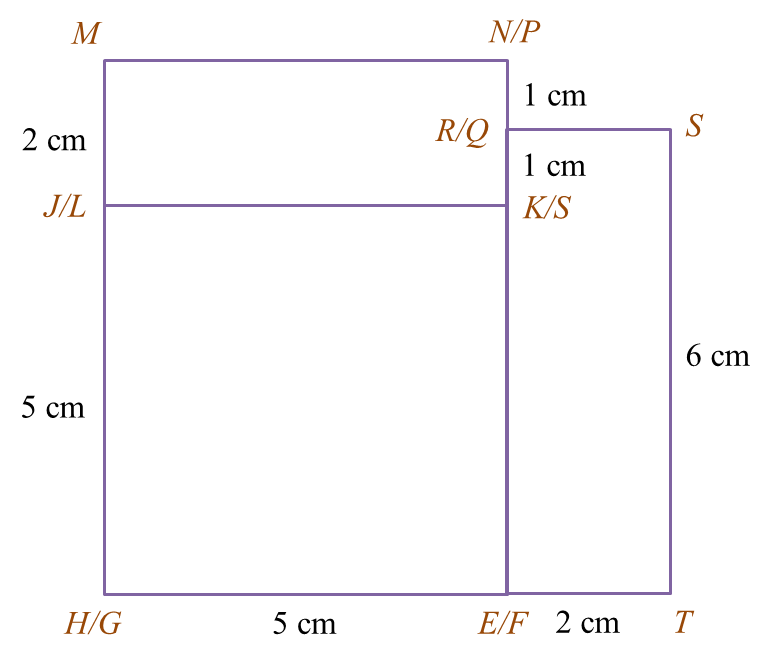
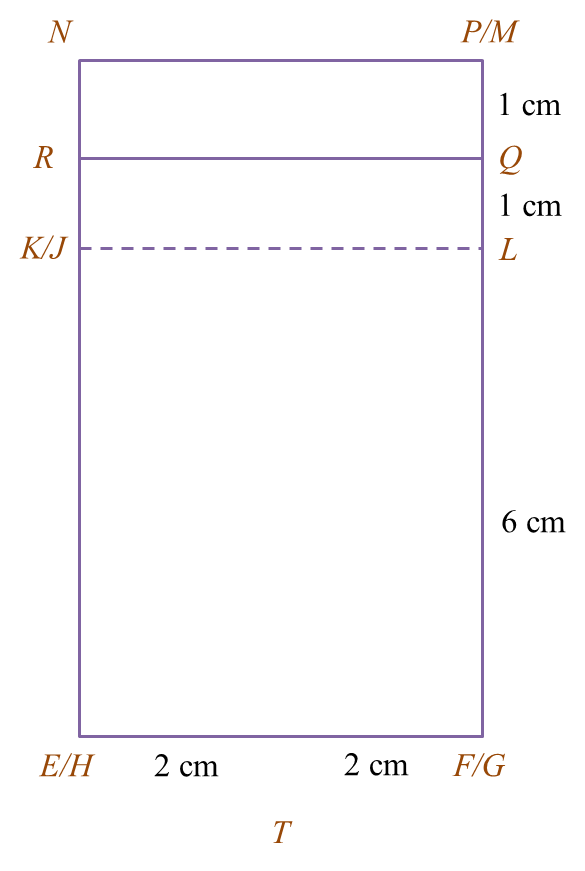
(a)


(b)(i)


(b)(ii)


6.7 SPM Practice (Long Questions)


Question 10 (12 marks):
Diagram shows a histogram which represents the mass, in kg, for a group of 100 students.

Diagram


(a)
Based on the Diagram, complete the Table in the answer space.

(b)
 Calculate the estimated mean mass of a student.

(c)
For this part of the question, use graph paper. You may use a flexible curve ruler.
Using a scale of 2 cm to 10 kg on the horizontal axis and 2 cm to 10 students on the vertical axis, draw an ogive for the data.

(d)
 Based on the ogive drawn in 10(c), state the third quartile.

Answer:


Solution:
(a)


(b)


Estimated mean mass = 8110 100 =81.1 kg


(c)


(d)
Third quartile
= 75th student
= 90.0 kg


6.7 SPM Practice (Long Questions)


Question 9 (12 marks):
The data in the Diagram shows the mass, in g, of 30 strawberries plucked by a tourist from a farm.

Diagram

(a)
Based on the Diagram, complete Table 3 in the answer space.

(b)
Based on Table, calculate the estimated mean mass of a strawberry.

(c)
For this part of the question, use graph paper.
By using the scale of 2 cm to 10 g on the horizontal axis and 2 cm to 1 strawberry on the vertical axis, draw a histogram for the data.

(d)
Based on the histogram drawn in 14(c), state the number of strawberries with the mass of more than 50 g.

Answer:


Solution:
(a)


(b)
Estimated mean mass = Total [ midpoint×frequency ] Total frequencies = 2( 14.5 )+5( 24.5 )+10( 34.5 )+8( 44.5 )+ 3( 54.5 )+2( 64.5 ) 2+5+10+8+3+2 = 1145 30 =38.17


(c)


(d)
Number of strawberries with the mass more than 50 g
= 3 + 2
= 5 


6.7 SPM Practice (Long Questions)


Question 8 (12 marks):
Diagram shows the marks obtained by a group of 36 students in a Mathematics test.

Diagram

(a)
Based on the data in Diagram, complete Table in the answer space.

(b)
Based on the Table, calculate the estimated mean mark of a student.

(c)
 For this part of the question, use graph paper.
By using the scale of 2 cm to 5 marks on the horizontal axis and 2 cm to 1 student on the vertical axis, draw a frequency polygon for the data.

(d)
Based on the frequency polygon in 8(c), state the number of students who obtained more than 40 marks.

Answer:
Table


Solution:
(a)

(b)
Estimated mean mark = Total [ Frequency×midpoint ] Total frequency = 2( 28 )+5( 33 )+7( 38 )+10( 43 )+             8( 48 )+4( 53 ) 2+5+7+10+8+4 = 1513 36 =42.03

(c)


(d)
Number of students who obtained more than 40 marks
= 10 + 8 + 4
= 22 students