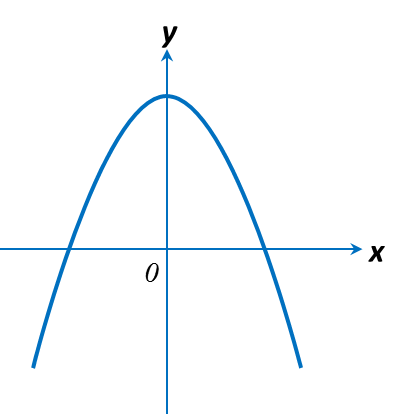
(B) Types of graphs of functions.
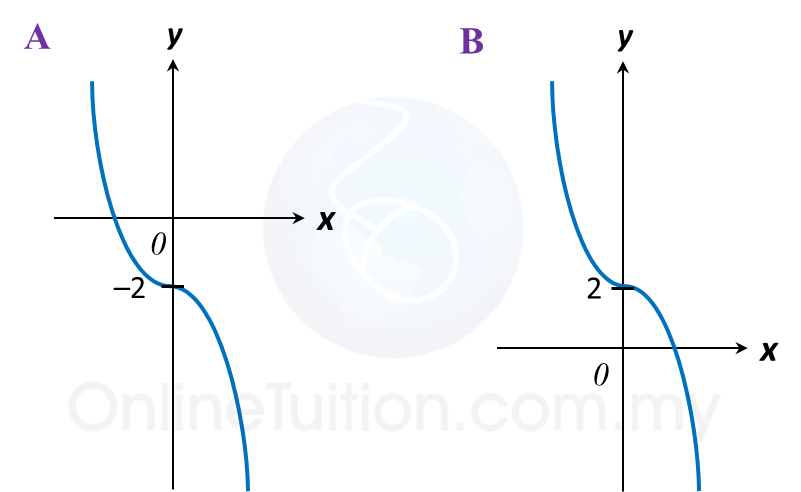
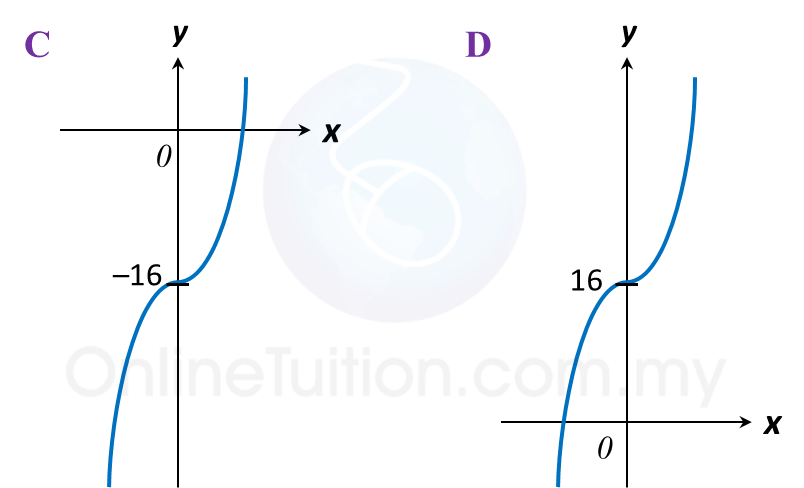
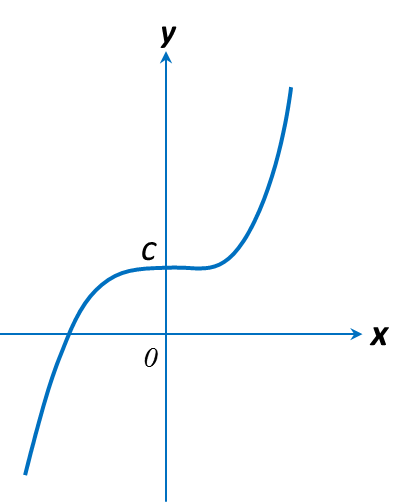
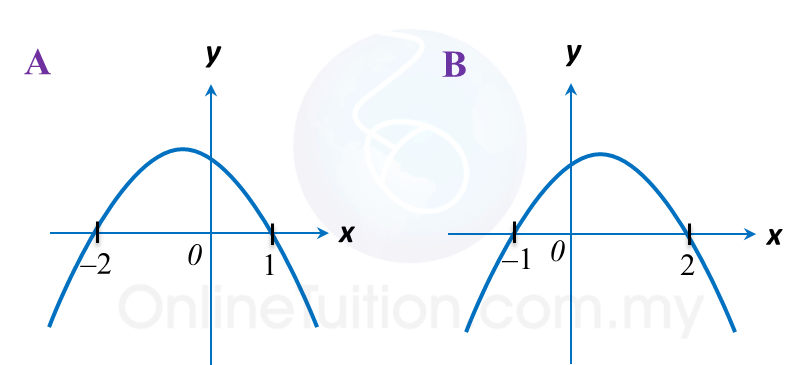
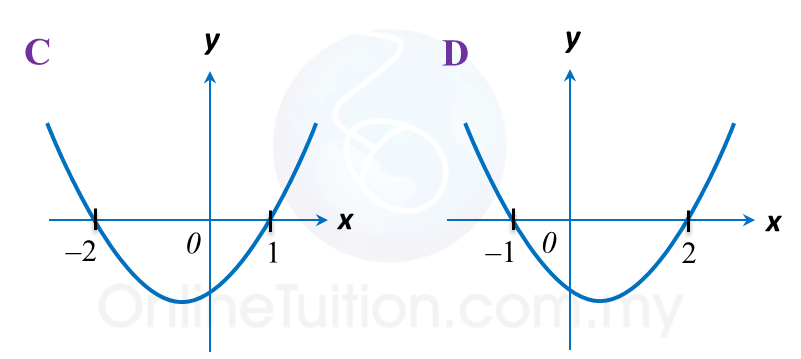
(c) Cubic function: y = ax3 + bx + c
Highest power of the variable x is 3.
(i) y = ax3 + bx + c, a> 0
(ii) y = ax3 + bx + c, a< 0

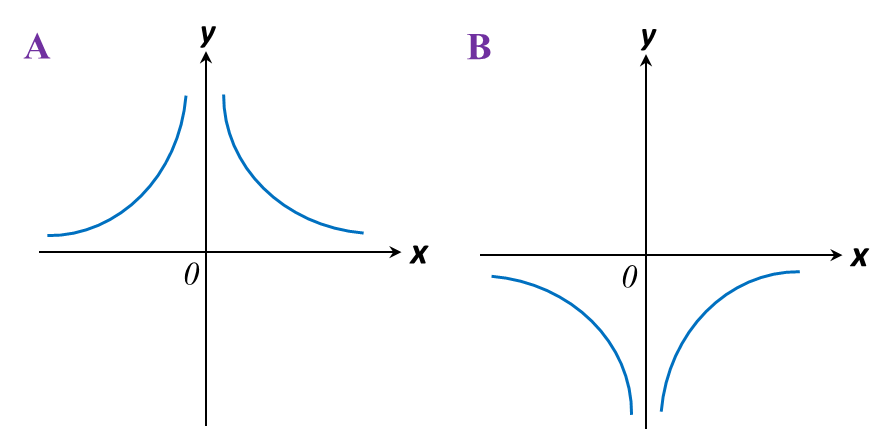
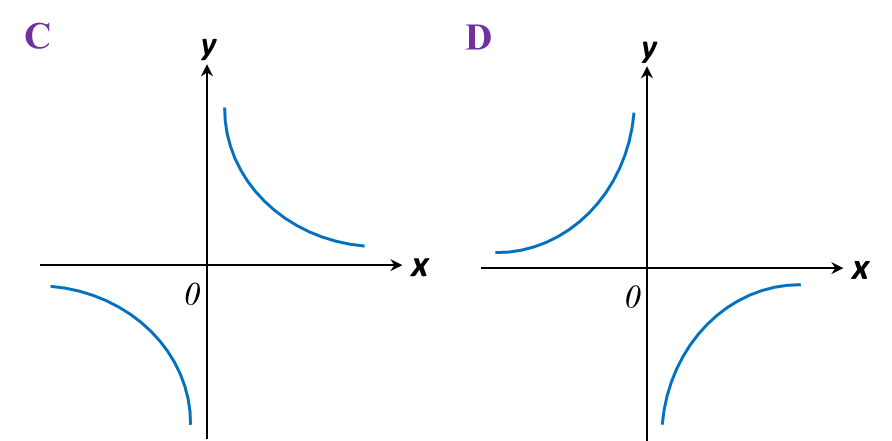
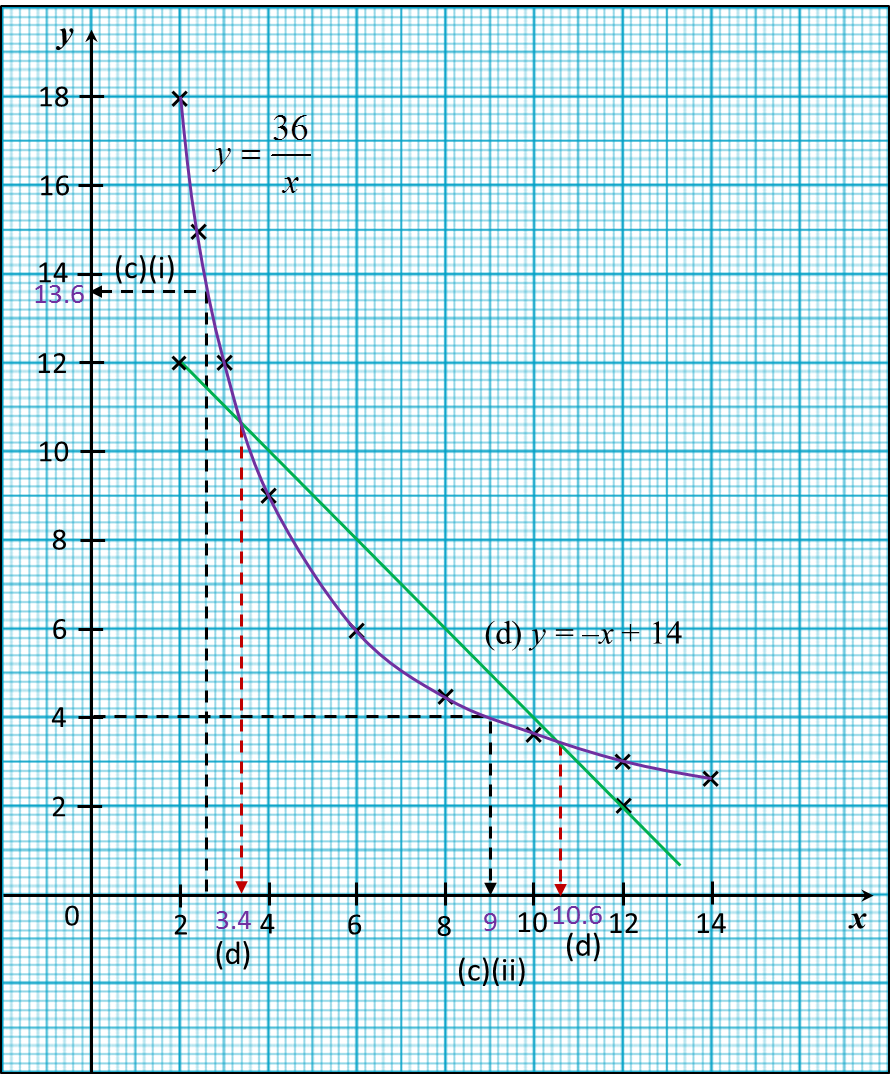
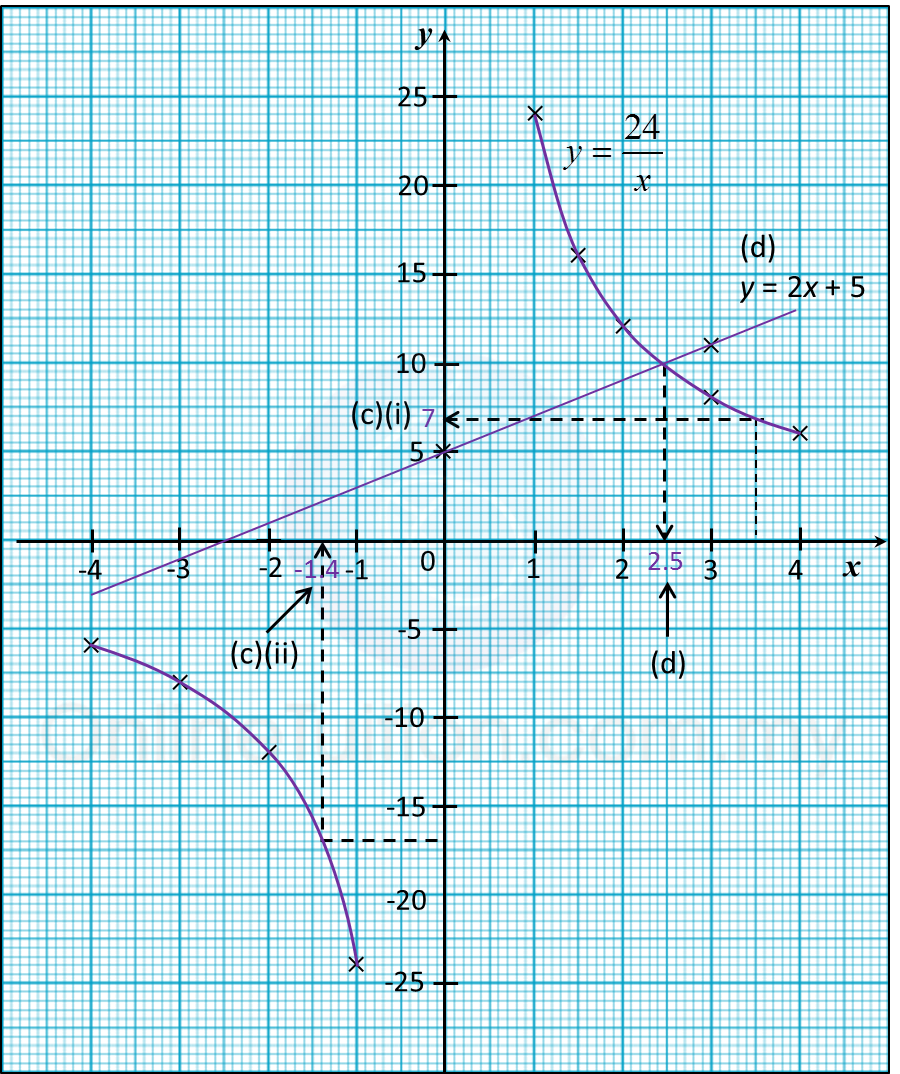
(d) Reciprocal function:
y=ax
Highest power of the variable x is –1.


x |
2 |
2.4 |
3 |
4 |
6 |
8 |
10 |
12 |
14 |
y |
18 |
15 |
9 |
6 |
3.6 |
3 |
2.6 |
x |
2 |
12 |
y = –x + 14 |
12 |
2
|
x |
–4 |
–3 |
–2 |
–1 |
1 |
1.5 |
2 |
3 |
4 |
y |
–6 |
k |
–12 |
–24 |
24 |
n |
12 |
8 |
6 |
x |
0 |
3 |
y = 2x + 5 |
5 |
11 |
x |
–2 |
–1 |
–0.5 |
1 |
2 |
3 |
4 |
4.5 |
5 |
y |
7 |
m |
– 2 |
–2 |
3 |
12 |
n |
33 |
42 |
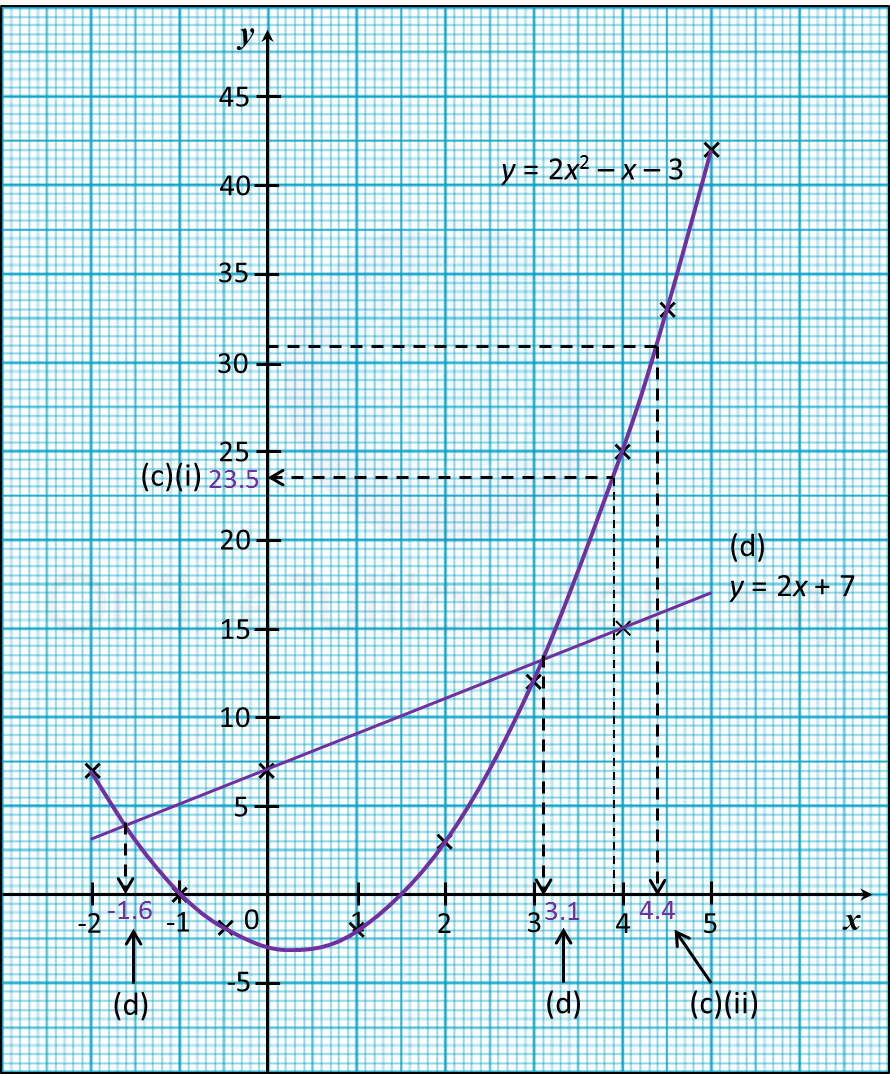
x |
0 |
4 |
y = 2x + 7 |
7 |
15 |