3.1c Stating the Coordinates of the Image of a Point under a Combined Transformation
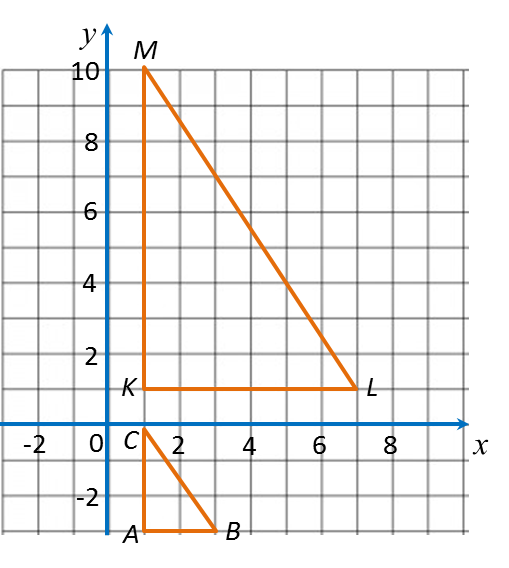
1. The coordinates of the image of a point, K, under the combined transformation AB can be determined by the following steps.
Step 1:
Determine the coordinates of K’, the image of K, under the first transformation, B.
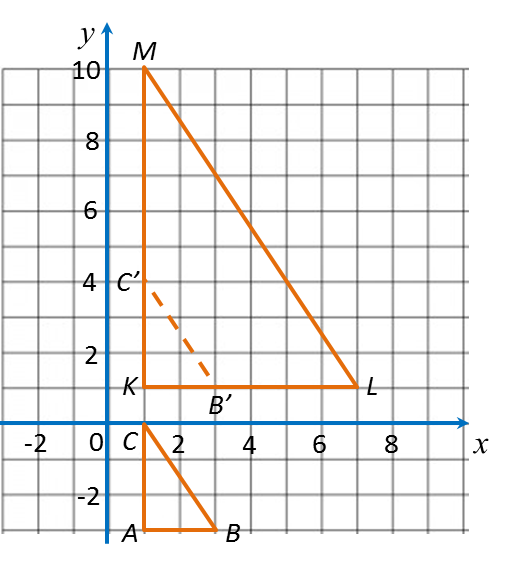
Step 2:
Determine the coordinates of K”, the image of K’, under the second transformation, A. K” is the image of K, under the combined transformation, AB.
Example:
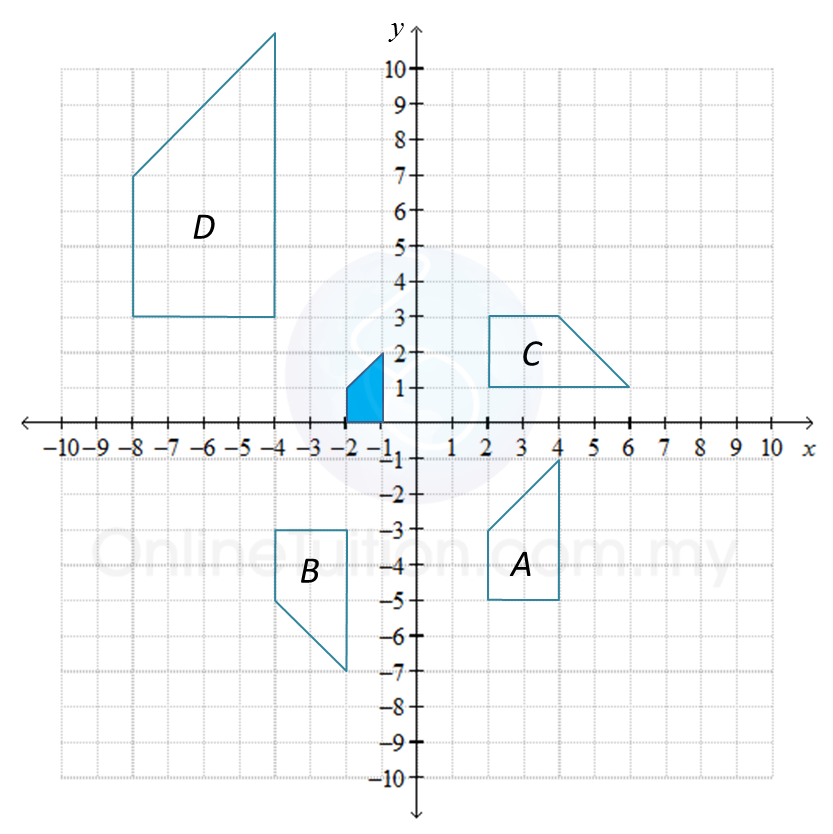
T, P, R and E are four transformations that are defined as follows:
P = Reflection in the y–axis.
R = Clockwise rotation 90o about the origin
E = Enlargement with scale factor of 3 and the origin as centre.
Find the coordinates of the image of the point A (3, –2) under each of the following combined transformation.
(a) TT (b) PT (c) ET (d) ER (e) EP
Solution:
(a)
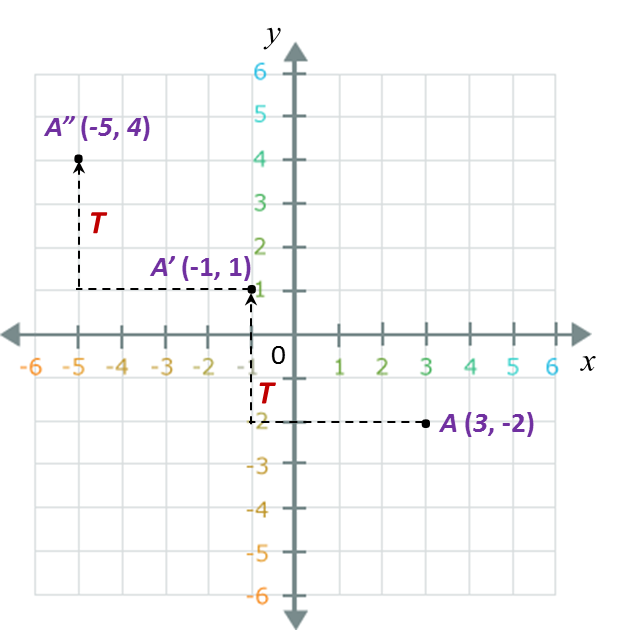
A(3, –2) → T → A’(–1, 1) → T → A”(–5, 4).
(b)
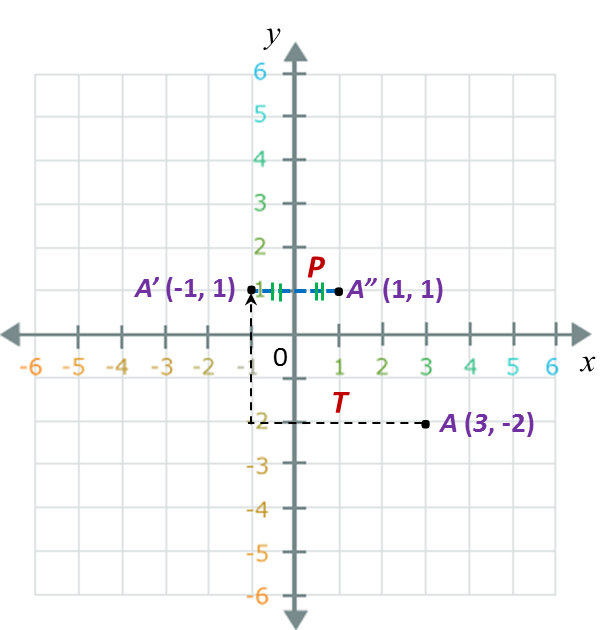
A(3, –2) → T → A’(–1, 1) → P → A”(1, 1).
(c)
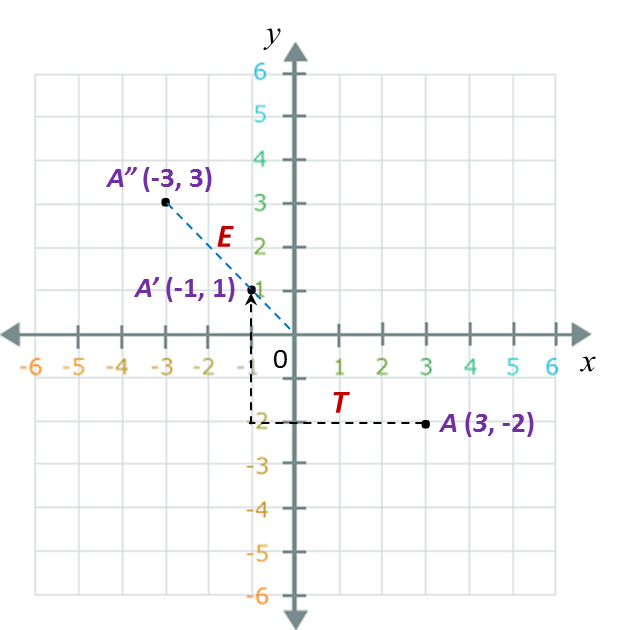
A(3, –2) → T → A’(–1, 1) → E → A”( –3, 3).
(d)
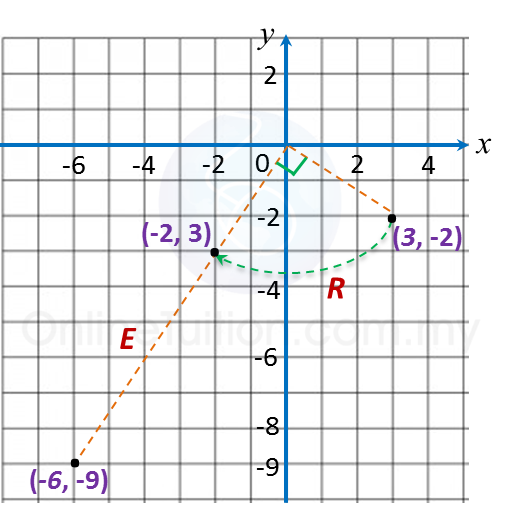
A(3, –2) → R → A’(–2, 3) → E → A”( –6, –9).
(e)
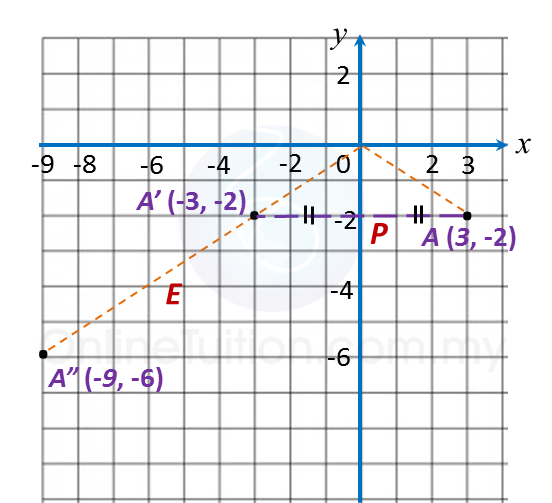
A(3, –2) → P → A’(–3, –2) → E → A”( –9, –6).