Question 7:

Solution:
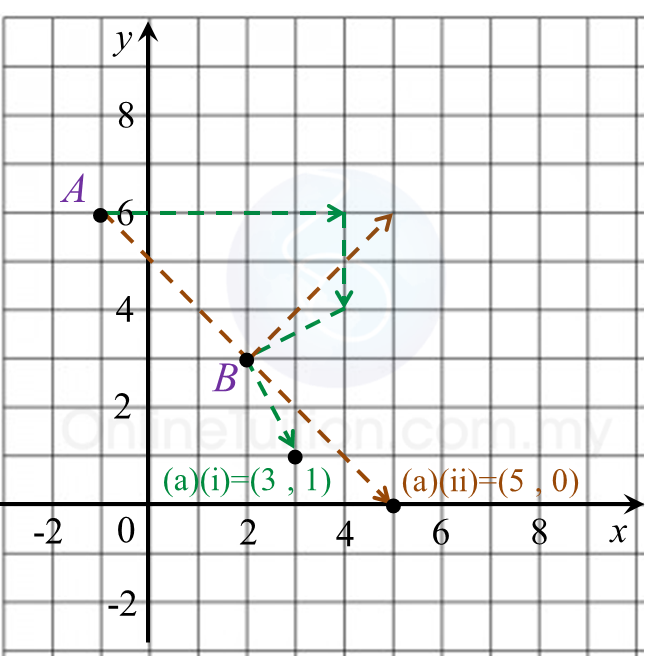
(a)
(b)
Distance travel by the object for the first 12 seconds
The diagram above shows the speed-time graph of a moving object for 15 seconds. Find
(a) the speed of the object at t = 9s.
(b) the distance travel by the object for the first 12 seconds.
Solution:
(a)
The speed of the object at t = 9s is 6 ms-1
(b)
= Area under the speed-time graph
= Area of triangle
= ½ × 12 × 8
= 48 m
Question 8:

Solution:
(a)
(b)
Acceleration from t=6s to t=12s= Gradient of speed-time graph=6−612−6=0 ms−2←The moving object is moving at a uniform speed
(c)
The diagram above shows the speed-time graph of a moving object for 15 seconds.
(a) Find the time interval when the object moves with constant speed.
(b) Find the acceleration from t = 6 s to t = 12 s.
(c) State the time when the object is stationary.
Solution:
(a)
Time interval when the object moves with constant speed
= 12 – 6
= 6 s
(b)
(c)
Time when the object is stationary is at 15 s.
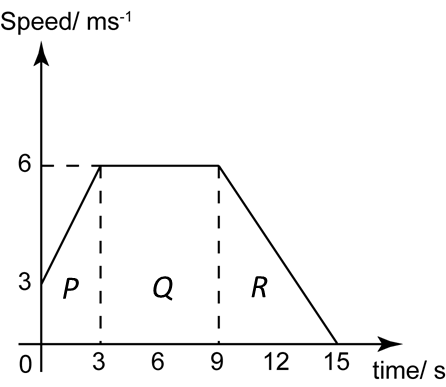
 Diagram 8.1
 Diagram 8.2