6.4 Frequency Polygons

6.4 Frequency Polygons
 
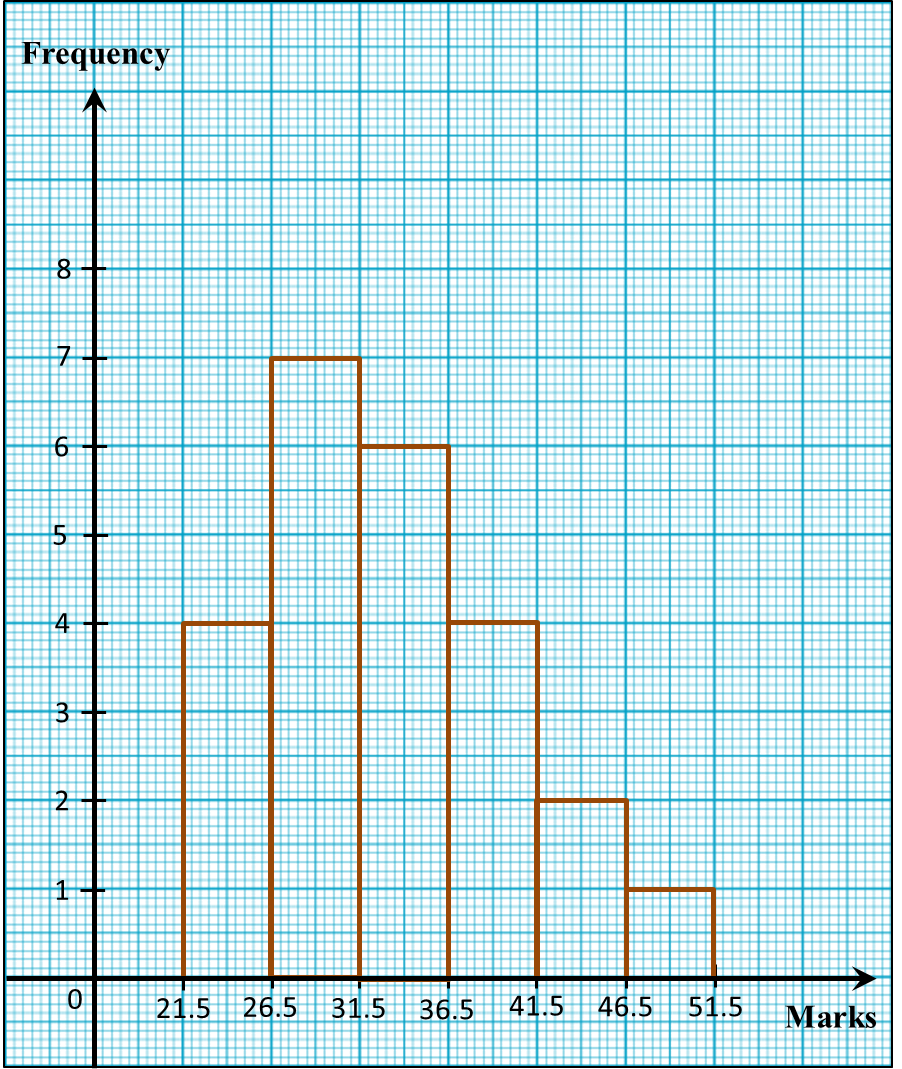
1. A frequency polygon is a line graph that connects the midpoints of each class interval at the top end of each rectangle in a histogram.
 
2. A frequency polygon can be drawn from a
(a) Histogram,
(b) Frequency table
 
3. Steps for drawing a frequency polygon:
Step 1: Add a class with 0 frequency before the first class and add also a class with frequency after the last class.
Step 2: Calculate the midpoints or mark the midpoints of the top sides of the rectangular bars including the midpoints of the two additional classes.
Step 3: Joint all the midpoints with straight lines.
 
Example:
The following frequency table shows the distance travelled by 38 teenagers by motorcycles in one afternoon.
 
Journey travelled (km)
Frequency
55 – 59
4
60 – 64
4
65 – 69
7
70 – 74
8
75 – 79
9
80 – 84
6
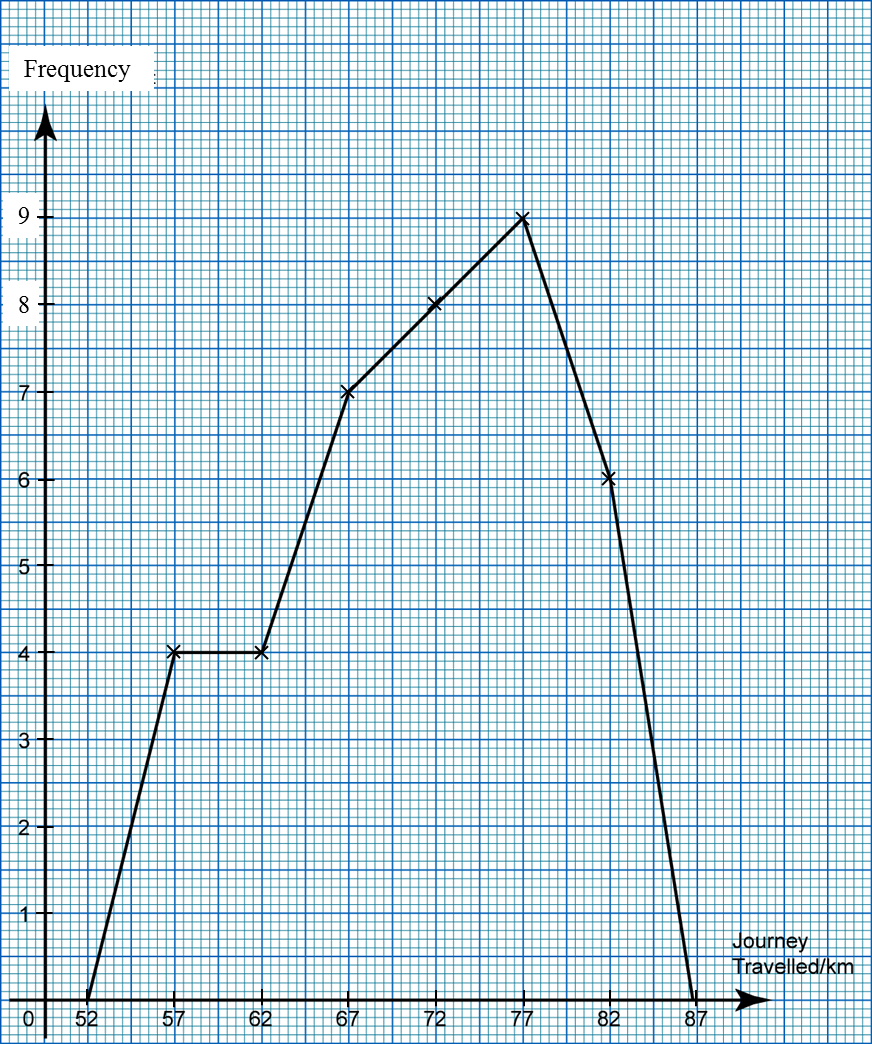
Draw a frequency polygon based on the frequency table.
 
Solution:


Journey travelled (km)
Frequency
Midpoint
50 – 54
0
52
55 – 59
4
57
60 – 64
4
62
65 – 69
7
67
70 – 74
8
72
75 – 79
9
77
80 – 84
6
82
85 – 89
0
87


6.2 Mode and Mean of Grouped Data

6.2 Mode and Mean of Grouped Data

(A) Modal Class
The modal class of grouped data is the class interval in the frequency table with the highest frequency.


(B) Class Midpoint
The class midpoint is the value of data that lies at the centre of a class.
Class midpoint = Lower limit + Upper limit 2  


(C) Calculating the Mean of Grouped Data

The steps to calculate the mean of grouped data are as follows.

Step 1: Calculate the midpoint value of each class.
Step 2: Calculate the value of (frequency × midpoint value) of each class.
Step 3: Calculate the sum of the values of (frequency × midpoint value) of all the classes.
Step 4: Calculate the sum of all the frequencies of all the classes.
Step 5: Calculate the value of the mean using the formula below.
Mean of grouped data,  x ¯ = Sum of (frequency × midpoint) Sum of frequencies = fx f Where Σ is the notation of summation, x is the midpoint of a class and f is its frequency.

6.7 SPM Practice (Long Questions)

Question 2:
Diagram below shows the marks, obtained by a group of 24 students in a mathematics quiz.

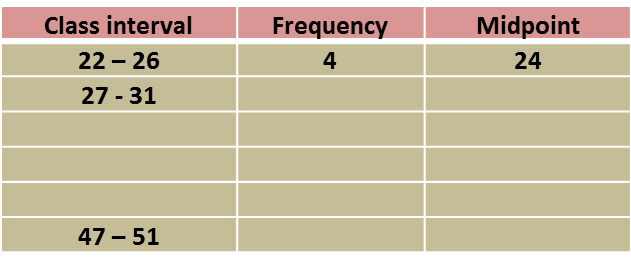
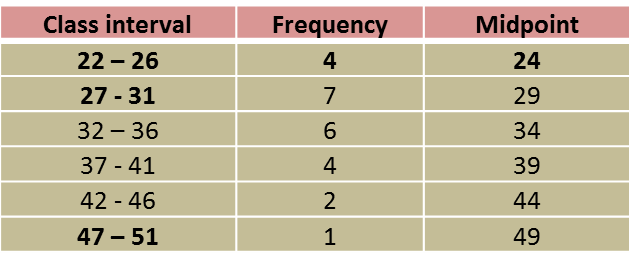
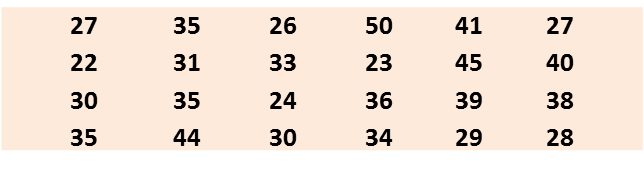
(a) Based on the data in diagram above, complete Table in the answer space.

(b) State the modal class.

(c) Calculate the estimated marks obtained by a student.

(d) For this part of the question, use graph paper.
By using a scale of 2 cm to 5 marks on the horizontal axis and 2 cm to 1 student on the vertical axis, draw a histogram for the data.

(e) Based on the histogram drawn in (d), state the number of students who obtain less than 32 marks in the quiz.

Answer:

Solution
:
(a)

(b) Modal class = 27 – 31 (highest frequency)

(c)  Estimated mean  4×24+7×29+6×34+4×39+2×44+1×49 24 796 24 =33.17 marks

(d)


(e)
Number of students who obtained less than 32 marks
= 4 + 7
= 11

5.7 SPM Practice (Long Questions 2)

Question 3:
Diagram below shows a straight line JK and a straight line ST drawn on a Cartesian plane. JK is parallel to ST.


Find
(a) the equation of the straight ST,
(b) the x-intercept of the straight line ST.

Solution:
(a) 
JK is parallel to ST, therefore gradient of JK = gradient of ST.
= 8 0 0 4 = 2
Substitute m = –2 and S (5, 6) into y = mx + c
6 = –2 (5) + c
c = 16
Therefore equation of ST: y = –2x + 16

(b)

For x-intercept, y = 0
0 = –2x + 16
2x = 16
x = 8
Therefore x-intercept of ST = 8


Question 4:


In the diagram above, PQRS is a parallelogram. Find
(a)  the gradient of SR,
(b) the equation of QR,
(c)  the x-intercept of QR.

Solution:
(a)
PQ is parallel to SR, gradient of PQ = gradient of SR.
Gradient of SR= 6 3 =2

(b)
Gradient of QR= 86 50 = 2 5 Substitute m= 2 5  and R (5,8) into y=mx+c 8= 2 5 ( 5 )+c c=6 Therefore equation of QR: y= 2 5 x+6

(c)
For x-intercept, y = 0 0 = 2 5 x + 6 x = 15
Therefore x-intercept of QR = –15.

5.7 SPM Practice (Long Questions 3)

Question 5:

 
In the diagram above, a straight line 5x + 7y + 35 = 0 intersects with the x-axis and y-axis at R and S respectively. Determine
(a) the gradient of the straight line RS.
(b) the x-intercept of the straight line RS.
(c) the distance of RS.
 
Solution:
(a)
5 x + 7 y + 35 = 0 7 y = 5 x 35 y = 5 7 x 5 The gradient of the straight line R S = 5 7 .

(b)
At x-intercept, y = 0 0 = 5 7 x 5 5 7 x = 5 x = 7 x-intercept of the straight line R S = 7.

(c)
Point R = ( 7 , 0 ) and point S = ( 0 , 5 ) Distance of R S = ( 7 0 ) 2 + ( 0 ( 5 ) ) 2 Distance of R S = 49 + 25 Distance of R S = 74 units


Question 6:

 
In the diagram above, O is the origin of the Cartesian plane, AOB is a straight line and OA = AC. Find
(a) the coordinates of C.
(b) the value of h.
(c) the equation of BC.
 
Solution:
(a)
x-coordinate of C = –3 × 2 = –6
Therefore coordinates of C = (–6, 0).

(b)
Gradient of AO= Gradient of OB 0( 4 ) 0( 3 ) = h0 60 4 3 = h 6 h=8

(c)
Gradient of BC= 80 6( 6 ) = 8 12 = 2 3 At point C( 6,0 ), 0= 2 3 ( 6 )+c c=4 The equation of BC is, y= 2 3 x+4

5.2 Gradient of a Straight Line in Cartesian Coordinates

5.2 Finding the Gradient of a Straight Line

The gradient, m, of a straight line which passes through (x1, y1) and (x2, y2) is given by, 
 
mPQ  =  y 2 y 1 x 2 x 1


Example 1:


Find the gradient of the straight line joining two points and Q in the above diagram.

Solution:
P = (x1, y1) = (4, 3), Q = (x2, y2) = (10, 5)

Gradient of the straight line PQ
= y 2 y 1 x 2 x 1 = 5 3 10 4 = 2 6 = 1 3


Example 2:
Calculate the gradient of a straight line which passes through point A (7, -3) and point B (-3, 6).

Solution:
A = (x1, y1) = (7, -3), B = (x2, y2) = (-3, 6)

Gradient of the straight line AB
= y 2 y 1 x 2 x 1 = 6 ( 3 ) 3 7 = 9 10

5.4 Equation of a Straight Line


5.4 Equation of a Straight Line: y = mx + c

1. Given the value of the gradient, m, and the y-intercept, c, an equation of a straight line
y = mx + can be formed.

2. If the equation of a straight line is written in the form y = mx + c, the gradient, m, and the y-intercept, c, can be determined directly from the equation.

Example:
Given that the equation of a straight line is y = 3 – 4x. Find the gradient and y-intercept of the line?
 
Solution:
y= 3 – 4x
y= – 4x + 3 ← (y = mx + c)
Therefore, gradient, m = – 4
y-intercept, c = 3


3. If the equation of a straight line is written in the form ax + by + c = 0, change it to the form y = mx + c before finding the gradient and the y-intercept.

Example:
Given that the equation of a straight line is 4x + 6y– 3 = 0. What is the gradient and y-intercept of the line?

Solution:
4x + 6y – 3 = 0
6y = –4x + 3

y= 2 3 x+ 1 2 y=mx+c  Gradient m= 2 3      yintercept, c= 1 2
 

5.6 SPM Practice (Short Questions)


Question 1:
Diagram below shows a straight line RS on a Cartesian plane.
 
Find the gradient of RS.

Solution:
Using gradient formula  y 2 y 1 x 2 x 1 Gradient of RS= 31 5( 1 ) = 2 6 = 1 3


Question 2:
In diagram below, PQ is a straight line with gradient  1 2 .


Find the x-intercept of the straight line PQ.

Solution:
Using the gradient formula, m= y-intercept x-intercept 1 2 =( 3 x-intercept ) x-intercept=3×( 2 )=6


Question 3:
Diagram below shows a straight line RS drawn on a Cartesian plane.

 
It is given that the distance of RS is 10 units.
Find the gradient of RS.

Solution:
RS=10 units, OS=6 units OR= 10 2 ( 6 ) 2 =8 units y-intercept of RS=6 x-intercept of RS=8 Using the gradient formula, m= y-intercept x-intercept  Gradient of RS=( 6 8 )= 3 4


Question 4:
The gradient of the straight line 3x – 4= 24 is

Solution:
Rearrange the equation in the form y = mx+ c
3x – 4y = 24
4y = 3x – 24
y = 3 4 x 6

Therefore, gradient of the straight line = 3 4 .


Question 5:
Determine the y-intercept of the straight line 3x + 2y = 5

Solution:
For y-intercept, x = 0
3(0) + 2y = 5
   y= 5 2 y-intercept= 5 2 .


5.7 SPM Practice (Long Questions 1)

Question 1:
In diagram below, ABCD is a trapezium drawn on a Cartesian plane. BC is parallel to AD and O is the origin. The equation of the straight line BC is 3y = kx+ 7 and the equation of the straight line AD is y = 1 2 x + 3


Find
(a) the value of k,
(b) the x-intercept of the straight line BC.

Solution:

(a)
Equation of BC :
3y = kx + 7
y= k 3 x+ 7 3 Gradient of BC= k 3 Equation of AD: y= 1 2 x+3 Gradient of AD= 1 2 Gradient of BC= gradient of AD k 3 = 1 2 k= 3 2

Gradient of BC = gradient of AD
k 3 = 1 2 k = 3 2

(b)

Equation of BC 3 y = 3 2 x + 7
For x-intercept, y = 0
3 ( 0 ) = 3 2 x + 7 3 2 x = 7 x = 14 3
Therefore x-intercept of BC 14 3


Question 2:
In diagram below, is the origin. Straight line MN is parallel to a straight line OK.


Find
(a) the equation of the straight line MN,
(b) the x-intercept of the straight line MN.

Solution:

(a)
Gradient of MN = gradient of OK
Gradient of MN
= 5 0 3 0 = 5 3

Substitute m = 5/3 and (–2, 5) into y = mx + c
5= 5 3 ( 2 )+c
15 = – 10 + 3c
3c = 25
c = 25/3

Therefore equation of MN y = 5 3 x + 25 3

(b) 
For x-intercept, y = 0
0 = 5 3 x + 25 3 5 3 x = 25 3
5x = –25
x = –5
Therefore x-intercept of MN = –5

5.3 Intercepts (Sample Questions)


Example 1:


The x-intercept of the line ST is

Solution:

The x-coordinate for the point of intersection of the straight line with x-axis is -0.4.
Therefore the x-intercept of the line ST is 0.4.


Example 2:
Find the x-intercept of the straight line 2x + 3y + 6 = 0.

Solution:
2x + 3y + 6 = 0
At x-intercept, y = 0
2x + 3(0) + 6 = 0
2x = –6
x = –3


Example 3
:
What is the y-intercept of the straight line 12x – 15y = 60?

Solution:
12x – 15y = 60
At y-intercept, x = 0
12(0) – 15y = 60
– 15y = 60
= –4