Long Question 6


Question 6:
Diagram below shows part of the curve   y = 2 ( 3 x 2 ) 2  which passes through (1, 2).


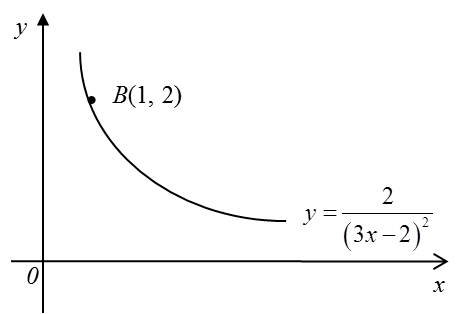
(a) Find the equation of the tangent to the curve at the point B.
(b) A region is bounded by the curve, the x-axis and the straight lines x = 2 and x = 3.
(i) Find the area of the region.
(ii) The region is revolved through 360° about the x–axis. Find the volume generated, in terms of p.

Solution:
(a)
y = 2 ( 3 x 2 ) 2 = 2 ( 3 x 2 ) 2 d y d x = 4 ( 3 x 2 ) 3 ( 3 ) d y d x = 12 ( 3 x 2 ) 3 d y d x = 12 ( 3 ( 1 ) 2 ) 3 , x = 1 d y d x = 12 y 2 = 12 ( x 1 ) y 2 = 12 x + 12 y = 12 x + 14


(b)(i)

Area = 2 3 y d x = 2 3 2 ( 3 x 2 ) 2 d x = 2 3 2 ( 3 x 2 ) 2 d x = [ 2 ( 3 x 2 ) 1 1 ( 3 ) ] 2 3 = [ 2 3 ( 3 x 2 ) ] 2 3 = [ 2 3 [ 3 ( 3 ) 2 ] ] [ 2 3 [ 3 ( 2 ) 2 ] ] = 2 21 + 1 6 = 1 14 unit 2


(b)(ii)
Volume generated = π y 2 d x = π 2 3 4 ( 3 x 2 ) 4 d x = π 2 3 4 ( 3 x 2 ) 4 d x = π [ 4 ( 3 x 2 ) 3 3 ( 3 ) ] 2 3 = π [ 4 9 ( 3 x 2 ) 3 ] 2 3 = π [ 4 9 [ 3 ( 3 ) 2 ] 3 ] [ 4 9 [ 3 ( 2 ) 2 ] 3 ] = π ( 4 3087 + 4 576 ) = 31 5488 π unit 3

Steps To Draw The Line Of Best Fit

Steps to draw a line of Best Fit
(i) Select suitable scales for the x-axis and the y-axis, make sure the points plotted accurately and the graph produced is large enough on the graph paper,
(ii) Mark the points correctly,
(iii) Use a long and transparent ruler to draw the line of best fit.

Step 1 : Select the suitable scale on x and y axis 

(the graph produced must be more than 50% of the graph paper)


Step 2 : Mark the points correctly


Step 3 : Draw the Line of Best Fit
 
* Note
 -the line passes through four points 
-one point is above the line
-one point is below the line


SPM Practice 2 (Question 1 – 3)

Question 1:
Reduce non-linear relation,  y=p x n1 , where k and n are constants, to linear equation.  State the gradient and vertical intercept for the linear equation obtained.
[Note : Reduce No-linear function to linear function]

Solution:


Question 2:
The diagram shows a line of best fit by plotting a graph of  y 2 against  x .

  1. Find the equation of the line of best fit.
  2. Determine the value of
    1. x when y = 4,
    2. y when x = 25.
Solution:


Question 3:
The diagram shows part of the straight line graph obtained by plotting y against x 2 .

Express y in terms of x.

Solution:


SPM Practice 3 (Linear Law) – Question 1


Question 1 (10 marks):
Use a graph to answer this question.
Table 1 shows the values of two variables, x and y, obtained from an experiment.
The variables x and y are related by the equation y h = hk x , where h and k are constants.


(a) Plot xy against x, using a scale of 2 cm to 1 unit on the x-axis and 2 cm to 5 units on the xy-axis.
Hence, draw the line of best fit.

(b) Using the graph in 9(a), find
(i) the value of h and of k,
(ii) the correct value of y if one of the values of y has been wrongly recorded during the experiment.

Solution: 
(a)


(b)
y h = hk x xy h x=hk xy= h x+hk Y=mX+C Y=xy, m= h , C=hk


(b)(i)
m= 36.5 5.1 h = 36.5 5.1 h =7.157 h=51.22 C=4 hk=4 k= 4 h k= 4 51.22 k=0.0781


(b)(ii)
xy=21 3.5y=21 y= 21 3.5 =6.0 Correct value of y is 6.0.


Tips To Reduce Non-Linear Function To Linear Function

Tips:
(1)  The equation must have one constant (without x and y).
(2)  X and Y cannot have constant, but can have the variables (for example x and y).
(3)  m and c can only have the constant (for example a and b), cannot have the variables x and y.


Examples
(1)
X and Y cannot have constant, but can have the variables (for example x and y)


(2)
 m and c can only have the constant (for example a and b), cannot have the variables x and y


SPM Practice 2 (Linear Law) – Question 4

Question 4
The table below shows the corresponding values of two variables, x and y, that are related by the equation y = q x + p q x , where p and q are constants.


One of the values of y is incorrectly recorded.
(a) Using scale of 2 cm to 5 units on the both axis, plot the graph of xy against x 2  .  Hence, draw the line of best fit

(b) Use your graph in (a) to answer the following questions:
(i) State the values of y which is incorrectly recorded and determine its actual value.
(ii) Find the value of p and of q.

Solution
Step 1 : Construct a table consisting X and Y.


Step 2 : Plot a graph of Y against X, using the scale given and draw a line of best fit


Steps to draw line of best fit - Click here

(b) (i) State the values of y which is incorrectly recorded and determine its actual value.


Step 3 : Calculate the gradient, m, and the Y-intercept, c, from the graph

Step 4 : Rewrite the original equation given and reduce it to linear form

Step 5 : Compare with the values of m and c obtained, find the values of the unknown required

Reduce Non-Linear Function To Linear Function – Examples (G) To (L)

Examples:
Reduce each of the following equations to the linear form. Hence, state the gradient and the Y-intercept of the linear equations in terms of  a and b.
(g)  k x 2 + t y 2 = x  
(h)  y = x p + q x  
(i)  h y = x + k x  
(j)  y = a b x  
(k)  y = a x b  
(l)  y = a b x + 1

[Note :
X and Y cannot have constant, but can have the variables (for example x and y)
 m and c can only have the constant (for example a and b), cannot have the variables x and y]

Solution:


SPM Practice 3 (Linear Law) – Question 3

Question 3
The table below shows the values of two variables, x and y, obtained from an experiment. The variables x and y are related by the equation a y = b x + 1 , where k and p are constants.


(a) Based on the table above, construct a table for the values of 1 x and 1 y . Plot 1 y against 1 x , using a scale of  2 cm to 0.1 unit on the 1 x - axis and  2 cm to 0.2 unit on the 1 y - axis. Hence, draw the line of best fit.
(b) Use the graph from  (b)  to find the value of
(i)  a,
(ii)  b.


Solution

Step 1 : Construct a table consisting X and Y.


Step 2 : Plot a graph of Y against X, using the scale given and draw a line of best fit

Steps to draw line of best fit - Click here


Step 3 : Calculate the gradient, m, and the Y-intercept, c, from the graph


Step 4 : Rewrite the original equation given and reduce it to linear form

Step 5 : Compare with the values of m and c obtained, find the values of the unknown required